Dec 21, 2023
Eurex
FIC Credit Market Snapshot November 2023
When stars align – Government and Corporate bond ETFs rally on risk compression
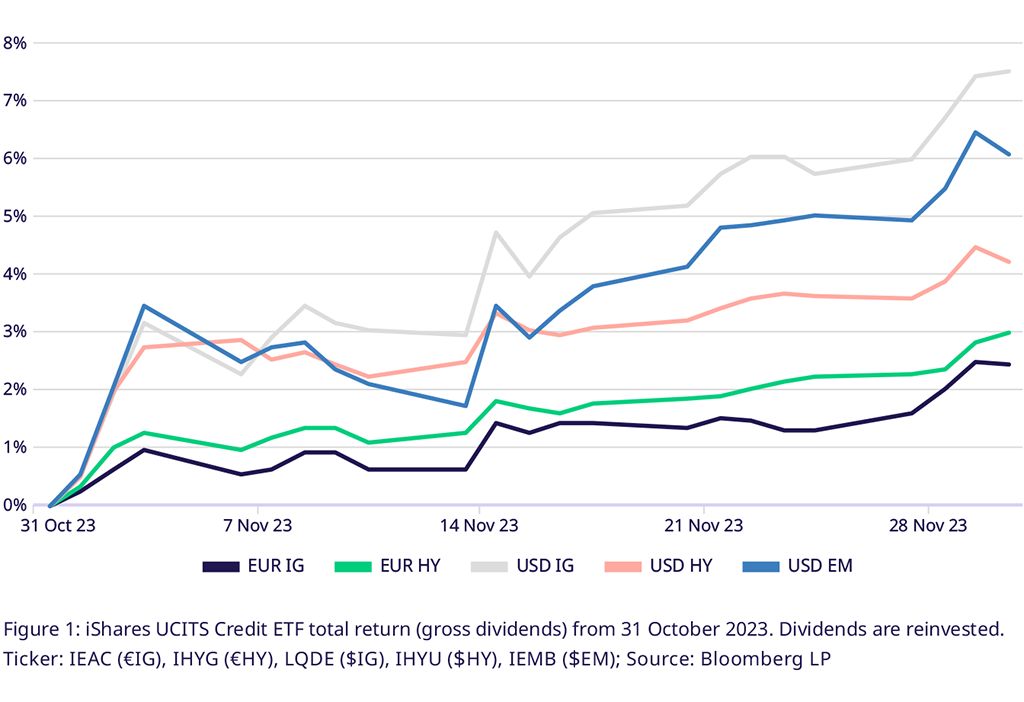
November rally across asset classes propels high yield and $-denominated long duration. $IG +7.5%, $EM +6.1%, $HY+4.2%
Credit markets globally suffered from rising curves and widening spreads throughout October. November finally brought a massive rally across asset classes on the hope that central banks may pull off a soft(-ish) landing. Multiple data points from the US and Europe supported the view that the tightening measures may have a limited impact on economic growth and that future central bank activity will be skewed to the dovish side. US CPI came in slightly below median expectations at 3.2%, and even though Jerome Powell and Fed officials were quick to assert their commitment to bringing inflation under control, the markets took slowing PPI, industrial production, and rising unemployment (3.9% in October) as a confirmation.
Long duration bonds were supported by bull-flattening curves, propelling the $-Investment grade corporate bond UCITS ETF (LQDE) to gains of 7.5% over the month, followed by $EM Sovereign Credit (IEMB, +6.1%) and $-High Yield (IHYU, +4.2%). In the Eurozone, a similar narrative of tightening measures having limited impact was supported by aggregated CPI stabilizing in October, with GDP slightly rising 0.1% and PMI data showing contraction but improving from the previous reading. €IG (IEAC, +2.4%) underperformed vs €HY (IHYG, +3%).
Duration profits from sovereign curve bull-flattening. US T 20yr+ +9.1%, 7-10yr +4.2%
After months of losses driven by the US curve bear-flattening, duration was rewarded again in November. In the US, 2-year yields fell 40bps, while the 10yr+ tenors reduced by more than 60bps. Higher duration bond ETFs, like the 20yr+ Treasury UCITS ETF (IDTL) that gained +9.1%, profited accordingly. In shorter tenors 1-3yr Treasuries (IDBT, +2.4%) and 7-10yr (+4.2%) gains were similarly driven. In Europe, the German sovereign curve saw a similar bull-flattening, with 2-year yields falling ~20bps, while 10s fell 35bps.
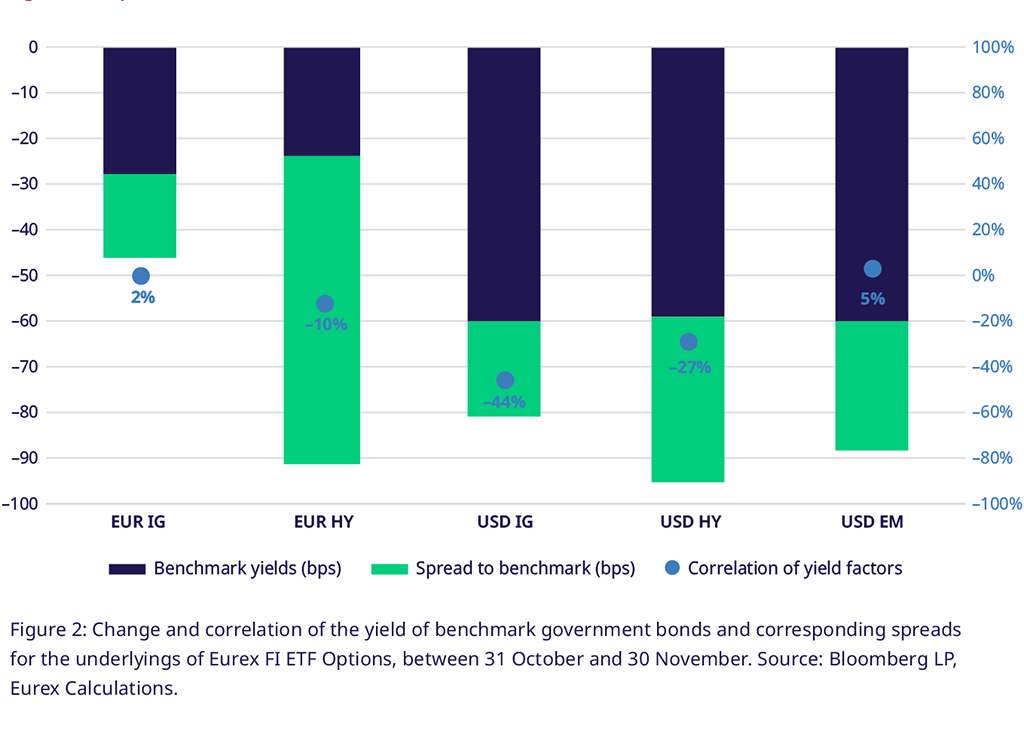
Credit spreads rally across global markets, led by €HY with -67bps. However, duration outweighed carry
High yield investors in the US and Europe enjoyed a 90+bps fall in total yields. In aggregate, the curve was the main driver in the US, where the spread of $HY added 36bps to the 59bps fall in yields of the closest treasury bond. In Europe, the roles were reversed, and 67bps out of the 91bps yield reduction stemmed from the spread. The reliance of shorter duration high yield ETFs ($HY: 3.6, €HY: 2.6) on high yields did however benefit the higher duration ETFs ($IG: 8.5, $EM: 6.4).
Spreads are tight compared to 1yr and 5yr historical averages. $IG spreads more than 1σ below mean
The recent rally has pushed spreads across credit markets below the historical average. However, calling credit overbought because of the 12-month average might be a stretch. Spreads had spiked in October last year, far above the usual conditions. We prefer to look at the 5yr average instead. This paints a more subdued picture. Only $IG spreads are more than one standard deviation(σ) below the 5-yr mean, and €IG spreads are slightly above the measure.
Rolldown to favor longer-term corporates (5yr+) on positive 5s10s-spreads following the rally in yields
The benchmark government bond yield and spread curves imply rolldown gains in the mid-to-long duration tenors. All else being equal, longer-term bonds will benefit from spreads between the 5yr and 10yr tenors turning positive as curves bear-steepened in October. In the US, the 5s7s spread ended the month at 6bps, while 7s10s ended the month flat (-1.5bps). OAS spread curves in $IG and €IG show the least spread in the front 1-3yr tenor, with spread curves steep until the 10yr tenor. High Yield credit curves, on the other hand, are inverted in later tenors and less attractive from a roll down perspective.
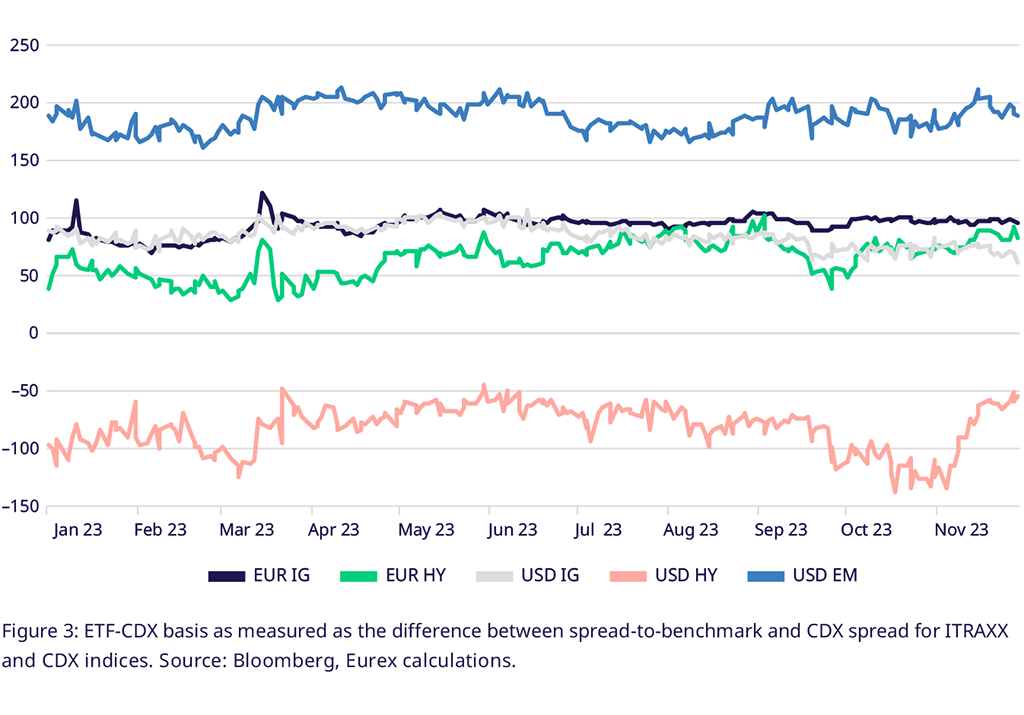
Relative pricing of $HY vs. CDX HY improves as basis contracts by 78bps on 114bps CDX rally
$-denominated high yield debt has been the only segment where CDX spreads are higher than the corresponding UCITS ETF underlying. The average spread of CDX HY fell 114bps to just above 402bps on Nov 30th compared to a rally of just 36bps in $HY. CDX spreads price credit risk 1.6σ below the 12-month average, compared to 0.8σ for $HY. All segments traded more than 1σ rich. However, the picture flips when we look at the 5yr history. Across all segments, CDX spreads are broadly in line with long term averages, trading slightly rich.
Hedging costs low because of low implied volatility and low spreads to overnight rates
The cost of downside protection is driven by two main factors: (1) the implied volatility and (2) the basis between the spot price of the underlying and the quoted forward price. The implied credit spread volatilities in credit default swap index options and options on bond futures reduced in November. The 3m CVIX indices for ITRAXX and IBOXX IG and HY Credit default swap indices in Europe and the US reduced by 25-30%, while the at-the-money implied volatilities reduced to levels more than one standard deviation below the 12M and 5yr averages across all Eurex listed Credit ETF Options.
Secondly, high overnight rates reduced the cost of carry in short positions. Higher overnight financing rates offset borrowing costs in derivatives hedging by liquidity providers and reduce the basis between spot and forward. Overnight-indexed swaps markets price significant cuts in both the US and Europe, which has driven inversion between overnight refinancing interest rates. The Euro Short-Term Rate (€STR) and the US Secured Overnight Financing Rate (SOFR) are pricing at 3.95% and 5.75%, yielding significantly more than longer tenors. This is, again, most pronounced for short- to medium-term debt in the 3-7yr tenors, where the inversion between benchmark yield curves and overnight financing is the highest.
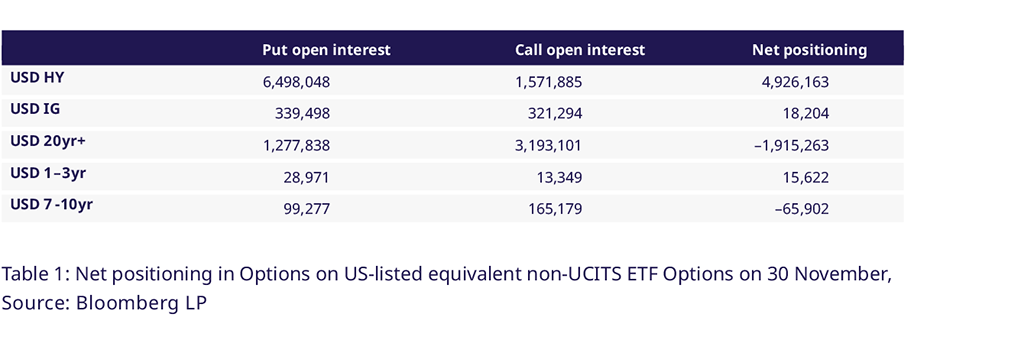
US-listed $HY Open Interest reduces, skews towards protection, traders of 20yr+ Treasury ETF Calls take risk off the table after a successful rally
The difference between put and call open interest for US-listed $HY ETF (HYG) options grew into the November expiry, when around 2bln of notional in puts expired. Clients ramped up their positions in puts by around 400k lots in the five days ahead of the expiry, while call open interest decreased by around 200k lots. Between Oct 31st and Nov 30th put open interest fell by 300k lots, while call OI reduced by 600k lots. The net positioning skewed towards puts by around 400k to around 5mln lots. Traders who had bought calls on the US-listed 20yr+ Treasury ETF (TLT) enjoyed the 9% rally in the month and took some risk off the table. While call OI still outweighs put OI by 1.9mln lots, the former has reduced by around 700k over the month.
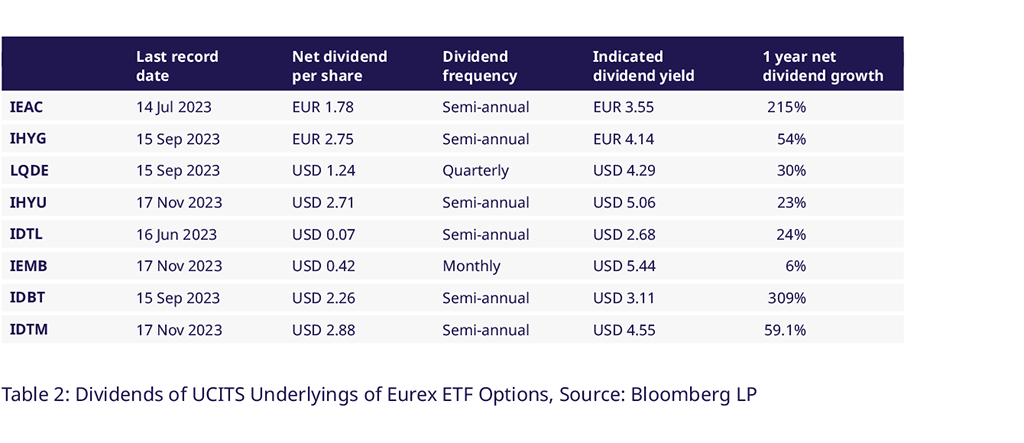
$HY, IDTM pay $2.7, $2.88 semiannual dividends, IEMB $0.42 in monthly dividend
The EM SOV dividend marks a 6% increase in dividends over the past twelve months, bringing up the total 12-month indicated dividend yield to 5.44%. The $HY indicated dividend yield grew by 23% YoY to 5.06%. The 7-10yr Treasury ETF (IDTM) saw dividend yield grow to 4.55% on a $2.88 net dividend. This marked a 60% increase over the last twelve months.
Utilizing Eurex Credit Futures & Options for Market Positioning
Eurex credit futures and options enable you to hedge existing portfolios against duration and credit risk in one go. Eurex Options on Fixed Income ETFs allow for directional positioning whilst limiting options premium paid with options spreads or more tailored option strategies.
Thinking about trading US Interest rates and volatility using UCITS compliant instruments? Gain exposure to US Treasury markets using the new Options on the IDBT (1-3yr Tenor) and IDTM (7-10yr Tenor) UCITS ETFs.
Contacts