Mar 16, 2023
Eurex
FIC Credit Market Snapshot March 2023
Benchmark yields drive credit market pull back in February, as macroeconomic uncertainty prevails
- January’s credit market rally dissipated in February. USD hardest hit with IG -3.9%, EM USD Sovereign Credit at -2.7%.
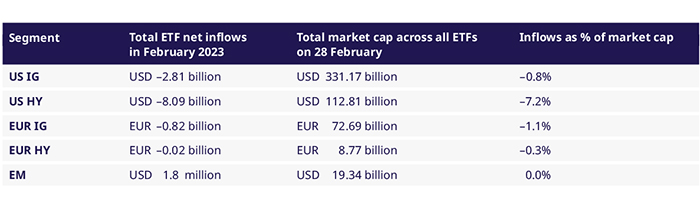
- Global credit ETFs lose capital amid losses. USD High Yield ETFs hardest hit with $ 8bln outflows.
- Spreads narrow for EUR IG, HY, USD HY, widen for USD IG, EM USD Sov Credit.
- 92% of EUR IG yield movement in Feb driven by the sovereign curve, 93% for US HY.
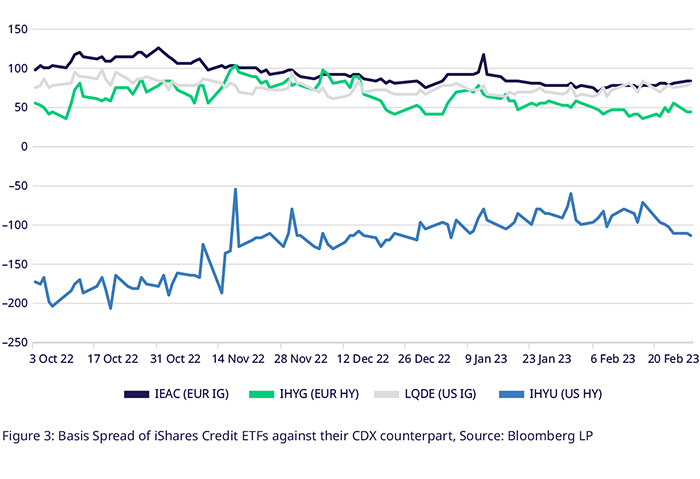
- ETF and OTC credit risk basis diverges again, basis for US HY increases 53bps.
In February, Corporate Credit markets globally gave back large parts of the gains made in January’s rally and the second half of December 2022. Mixed macroeconomic data throughout February failed to invigorate hopes for a soft landing and credit spreads remained relatively stable. Additionally, US and German sovereign yield curves twisted upwards while 2s10s inverted further, weighing on credit portfolios’ profit and loss statistics.
Risk capital retreated partly from credit markets as Credit ETFs globally saw some outflows, with USD-denominated assets hit the hardest. $ 8bln in USD High Yield ETFs were divested, 7.2% of the total assets on February 28th. USD Investment grade ETFs remain the best developed of all ETF markets after outflows of 0.8%, with $ 331bln in total assets on February 28th. In the smaller EUR Credit ETF space, we saw Investment Grade ETFs losing 1.1% of total assets, while high yield assets dropped by merely 0.3% during February.
The Bloomberg Euro Aggregate Corporate Total Return Index (EUR IG), tracking Euro Investment Grade credit, lost 1.44% between Jan 31st and Feb 28th. The average yield of index components reached 4.4% at the end of the month. European high yield credit, aggregated in the Bloomberg Liquidity Screened Euro High Yield Bond Index (EUR HY), could not extend its January gains (+3%) but only lost 0.2%. In the period between Dec 31st to Feb 28th, the EUR HY Index remained up 2.8%. Yields have climbed to 7.4% over the month.
The German benchmark yield curve bear-flattening was the primary driver for the performance of both European credit indices, as yields rose north of 35bps in the 2yr to 10yr tenors, with 2s10s inverting for an additional -10bps. Credit spreads continued to tighten, with the option-adjusted spread for EUR IG falling 4bps to 148bps, -98bps from the high of 243bps in October 2022. Still, 92% of the total yield moves over the period were driven by the benchmark yield rising 45bps. For EUR HY, spreads performed even better, falling 22bps to 411bps, -266bps lower than the high at the beginning of October 2022. Meanwhile, the benchmark yield rose 48bps for a net +26bps in yield-to-maturity for EUR HY. High yield bond performance is generally more shielded against yield moves, as they have comparatively low duration and convexity and are supported by higher yields.
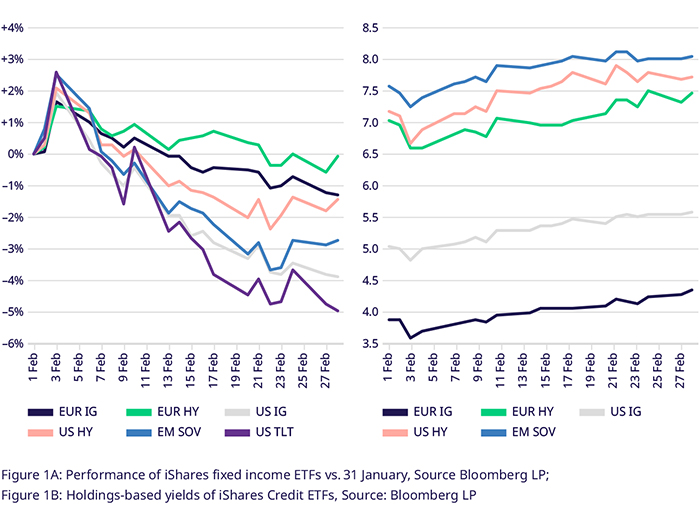
USD-denominated credit markets continue to exhibit higher volatility than their European counterparts. The main iShares UCITS ETFs on USD Investment Grade (LQDE) and High Yield (IHYU) Credit gained 5% and 4% in January. However, for LQDE, part of this advance was short-lived, as the ETF lost 4.12% over February. Higher risk tranches did experience lower losses as they are less susceptible to interest rate changes. IHYU lost only -1.63% over February, leaving the ETF up +2.28%. The average yield for LQDE rose to 5.6% and IHYU to 7.7%.
USD credit spreads diverged for investment grade and high yield segments. While LQDE saw its average spreads widen 16bps to 157bps, IHYU spreads contracted 3bps to 349bps. However, the primary driver of profit and loss was the US Treasury curve, which continued to bear-flatten. From the 2-year point on to the 10-year, we saw yields rising 50+ bps, with 2s ending the month at 483bps and 10s at 393bps. The upward shift was paired with the curve deepening its inversion in the 2s10s by 22bps to -90bps. For LQDE, this meant that 70% of the yield movement over the month was driven by the benchmark, while the share was even higher for IHYU at 93%.
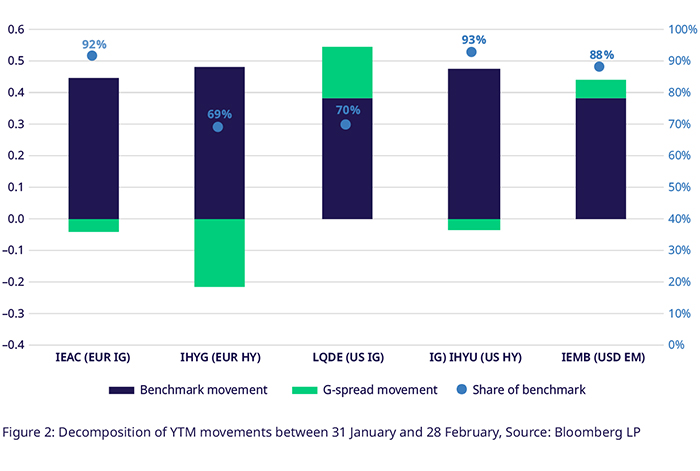
Long term Treasuries have been more volatile than credit, as high duration makes them extremely sensitive to rate rises. The iShares 20yr+ Treasury UCITS ETF (IDTL) lost 2.65% in February after a sensational +5.91% rally in January for a net +3.10%. The iShares J.P. Morgan USD EM Bond UCITS ETF (IEMB), on the other hand, has a lower duration at 7.3 and is marked against the US 10yr, which has led to the ETF losing 2.44% in February for a net +0.78% in the first two months of 2023. Again, the Treasury curve drove 88% of the yield movements for IEMB.
As of March 11th, OTC credit default swap markets view European high yield as riskier than the US counterpart. 5YR default probabilities for European HY, as captured in the iTraxx Crossover Index, are at 29.2% vs. 28.9% for its US counterpart. This shows US default risk catching up, as the iTraxx Crossover priced in an average 28% default probability on Feb 7th, while the US equivalent was at 25.8%.
Credit risk measures in European credit markets have diverged again between OTC derivatives and credit ETFs. The CDS-spread vs. I-spread basis of IEAC, i.e., the difference between the fund's average interpolated spread to the swap curve and corresponding credit default swap index spread has widened 5bps to 84bps. Similar observations can be made for iShares ETFs LQDE (+9.5bps), while the EUR High Yield Corp Bond UCITS ETF (IHYG) saw the spread tighten by 5bps. For US high yield, the IHYU ETF exhibited a negative basis throughout 2022, which has increased throughout Q4 2022 into January 2023. This trend stopped in February, with the basis widening 53bps between Feb 1st and Feb 28th to -113bps.
Utilizing Eurex's Credit Futures & Options for Market Positioning
Eurex Credit Futures and Options enable you to hedge existing portfolios against duration and credit risk in one go. Eurex Options on Fixed Income ETFs allow for directional positioning while limiting options premium paid with options spreads or more tailored option strategies.
Market neutral credit spread trades between EUR IG and HY are now also possible at Eurex with our Bloomberg MSCI Euro Corporate SRI Index Futures (LXYA index) and Bloomberg Liquidity Screened Euro High Yield Bond Index Futures (AHWA Index).
Be it to position for a rally in credit markets or in search of alpha in a specific sector, our market makers are ready to show you prices at competitive spreads both in the order book and in broker-facilitated phone market trading. Reach out to the team for more insights and execution guidance.
Contacts