Apr 14, 2023
Eurex
FIC Credit Market Snapshot April 2023
Turmoil in the Banking sector drives outperformance in USD long-duration Credit in March
- Turmoil in the Banking sector drives the outperformance in US long-duration. US IG +2.78%, US IDTL +5.08%.
- European ETFs are preferred by investors, +5.2% in new investor capital in March for EUR HY.
- EUR credit spreads widened, with EUR HY yielding 490bps over Bunds.
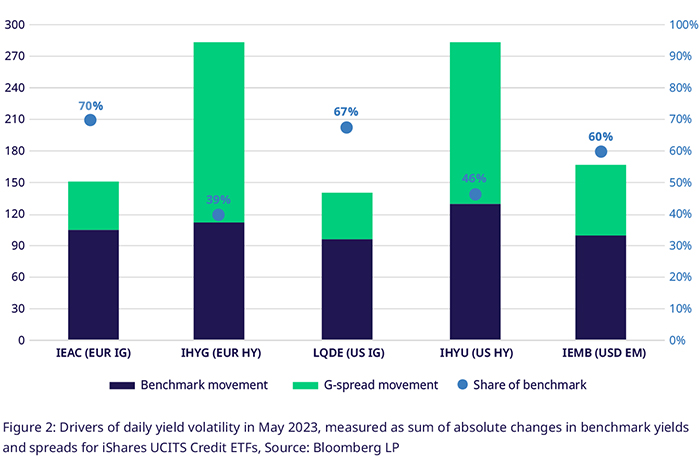
- 90% of US IG yield movement in January is driven by the sovereign curve bull-steepening, highlighting the need for holistic portfolio hedges.
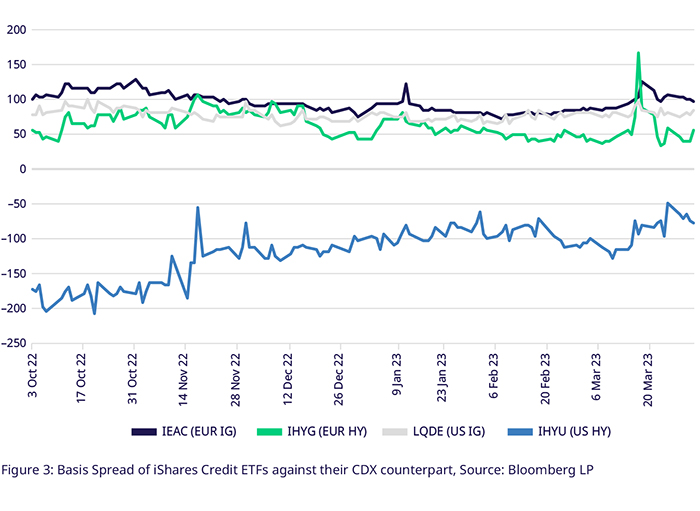
- ETFs and OTC instruments credit risk measures converge amid major hiccups, basis for EUR HY contracts rises to 166bps on 15 March.
Woes in the US banking system and the collapse of Credit Suisse put risk assets under pressure in early March, leading to some choppy price action in credit markets. Overall, changes in the benchmark yield curves dominated the price action in European and US Investment Grade and US High Yield debt. The German and US yield curves shifted lower and steepened, exhibiting the most violent moves in the 2-year to 10-year tenors. German 2y lost 41bps to 2.68%, while 5y and 10y fell 33bps and 21bps to 2.3% and 2.29%, respectively. In the US, 2y fell by 56bps to 4.02% by March 31st, while 5y lost 39bps and 10y reduced by 23bps, to 3.58% and 3.46%.
In March, European-focused credit ETFs were broadly preferred over those with a US focus. EUR Investment Grade ETFs saw inflows of € 2.15bln, 2.8% of the € 75.8bln of total assets held in the ETFs as of 31 March. European High Yield ETFs, which constitute a far smaller market of €9bln on 31 March, saw significant inflows on a relative basis, gaining € 470mln, or 5.2% of their total assets during March. In the US, Investment Grade was flat in terms of overall net flows in March and was preferred over High Yield, with the latter losing $ 2.37bln to reduce total assets to $ 110.7bln.
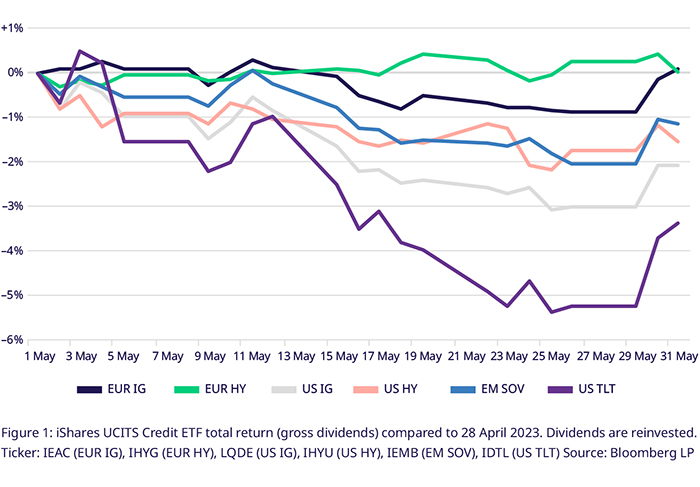
In Europe, Investment Grade corporate credit outperformed high yield on a total return basis. The Bloomberg Euro Aggregate Corporate Total Return Index (EUR IG), tracking Euro Investment Grade credit, rose +1% throughout March for a Q1 performance of +1.75%. European high yield credit, as aggregated in the Bloomberg Liquidity Screened Euro High Yield Bond Index (EUR HY), had a weaker March, gaining only 0.25% over the month. This pushed YTD total returns to 3.06%.
European credit remains attractive versus both sovereigns and equities in terms of spread to 10-year German Bunds and compared to European equities’ earnings yields. The spread of EUR IG versus Bunds rose to 188bps on 31 March, yielding a total of 4.21%. EUR HY spreads over Bunds rose to 490bps, as the index yield reached 7.38% by the end of March. Given the indices' lower duration of just 4.66 (EUR IG) and 3.38 (EUR HY) versus Bunds at 8.8 as of 31 March, European credit will be preferred if high interest rate volatility continues.
Equities are projected to face further headwinds with prospects of an economic downturn later this year, as the estimated earnings yield of the EURO STOXX 50® Index stood at 3.46% at the end of March. The 30-Day historical volatility of the index fared between 12 and 25 since Jan 2022, while EUR IG and HY have been between 1.5 and 9. This has led some analysts to prefer credit over equities in 2023.
European UCITS Credit ETFs have seen significant growth in their dividends, following income from higher coupons and higher yields. The iShares Core EUR Corp Bond UCITS ETF (IEAC), which tracks EUR IG, had seen its net dividend projected yield grow 99% to 2.5% in January. The iShares EUR High Yield Corp Bond UCITS ETF (IHYG) paid a net dividend of 2.35% on March 17th, marking an increase of 35% to the indicated net dividend yield. This trend will likely continue in the next semi-annual payments in Q3 if increasing inflows and high yields persist.
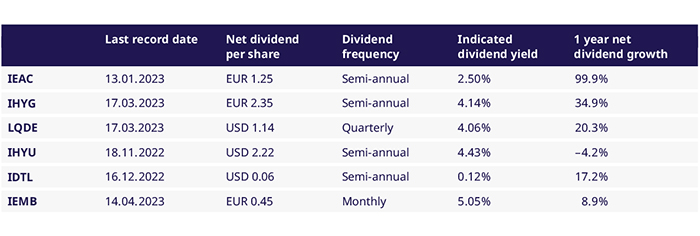
Falling yields in the US Treasury curve drove US outperformance versus Europe, especially in interest-rate-sensitive, longer-duration IG bonds. The iShares USD Corp Bond UCITS ETF (LQDE) had a duration of c. 7.4y on 31 March and rallied 2.54% over the month. On 17 March, it paid a net dividend of $1.14 per share. The iShares USD High Yield Corp Bond UCITS ETF (IHYU) rose 1.5% over the month, bringing Q1 total returns of both instruments to around 3.5%.
Emerging market USD-denominated sovereign debt benefitted from the movement of the benchmark as well, with risk concerns centered on dollar funding and interest rate sensitivity. The iShares J.P. Morgan USD EM Bond UCITS ETF (IEMB) rose 1.24% throughout the month. The ETF’s last monthly dividend stood at 0.44$ per share, indicating a net 12M yield of 5.05%, compared to the 3.08% estimated dividend yield for the MSCI Emerging Market Index. However, usage of the Fed’s Foreign and International Monetary Authorities Repo Facility, which allows foreign central banks to temporarily exchange Treasuries versus Dollars, rose to a combined $115bln in the last two weeks of March, potentially pointing to some cracks in the Dollar funding system.
Components of the USD corporate credit ETFs continue to provide positive returns versus 10y Treasuries, albeit the spread is less pronounced than in Europe. This is largely driven by lower implied interest rate volatility. LQDE portfolio components returned on average 1.7% above 10y, while IHYU returned 4% above the benchmark long term interest rate. For LQDE, the duration level of 8.4 for LQDE stood close versus the benchmark Treasury at 8.37. Three-month implied volatility in Europe and the US was priced at 11.26 versus 8.41.
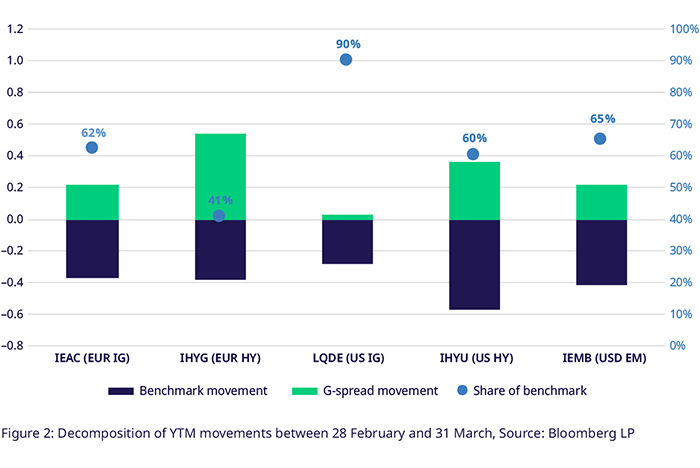
In a reversal of the dynamic of the first two months of 2023, credit spreads widened, and benchmark yields tightened, driven by uncertainty around funding conditions and potential ripple effects of the banking crisis. Riskier tranches of the European markets, as represented by IHYG, saw spreads widen significantly (55bps), more than double the 22bps of IEAC and 18bps more than its US counterpart IHYU (+37bps). LQDE saw the lowest growth in its credit spread (3bps) as US investors preferred liquid high-grade debt over less-liquid, riskier bonds amid the banking crisis.
The need for portfolio hedges along both the interest rate and credit risk dimensions was once again highlighted by benchmark yields being the dominant driver of returns for almost all ETFs discussed above. For IEAC, IHYU and IEMB, benchmark changes made up more than 60% of total yield moves over the period, topped by LQDE where the share was 90%. Only IHYG had credit spreads dominate, while benchmark moves still drove 41% of total yield moves.
As of 12 April, OTC credit default swap markets continue to perceive Europe as riskier than the US. 5-year default probabilities for European IG, as captured in the iTraxx Europe Index, are at 7.1% vs. 6.4% for its US counterpart. For high yield, the iTraxx Crossover prices in an average 32% default probability over the next five years, while the US equivalent is at 29.9%. This translates to a 35bps-50bps difference in default probabilities per year. Note that the differential in default probabilities is reflected in the respective credit spreads. Still, the differential was more pronounced for high yield, whereby EUR HY yields around 80bps more than US HY, with a 465bps spread over the government benchmark. For EUR IG, spreads were 10bps higher than for US IG on March 31st and stood at 170bps.
The basis between credit risk measures between OTC derivatives and credit ETFs spiked mid-month before normalizing again towards the end of the month. The CDS-spread vs. I-spread basis of IEAC, i.e., the difference between the fund’s average interpolated spread to the swap curve and corresponding credit default swap index spread, continues to be negative. Over the month, the difference widened from 80bps to 123 bps before falling to 97bps. The most extreme spike could be observed in IHYG (EUR HY), where the basis jumped to 166bps for a day on 15 March before settling back to a range of 40bps-50bps. The IHYU ETF showed a negative basis for US high yield throughout 2022. However, the spread between the two risk measures has been contracting since Q4 2022. This contraction continued into month’s end at -77bps amid some variance around the trend.
Utilizing Eurex's Credit Futures & Options for Market Positioning
Eurex Credit Futures and Options enable you to hedge existing portfolios against duration and credit risk in one go. Eurex Options on Fixed Income ETFs allow for directional positioning while limiting options premium paid with options spreads or more tailored option strategies.
Market neutral credit spread trades between EUR IG and HY are now also possible at Eurex with our Bloomberg MSCI Euro Corporate SRI Index Futures (LXYA index) and Bloomberg Liquidity Screened Euro High Yield Bond Index Futures (AHWA Index).
Be it to position for a rally in credit markets or in search of alpha in a specific sector, our market makers are ready to show you prices at competitive spreads both in the order book and in broker-facilitated phone market trading. Reach out to the team for more insights and execution guidance.
Contacts