Dec 10, 2025
Eurex
Focus on VSTOXX® Derivatives | November 2025 recap
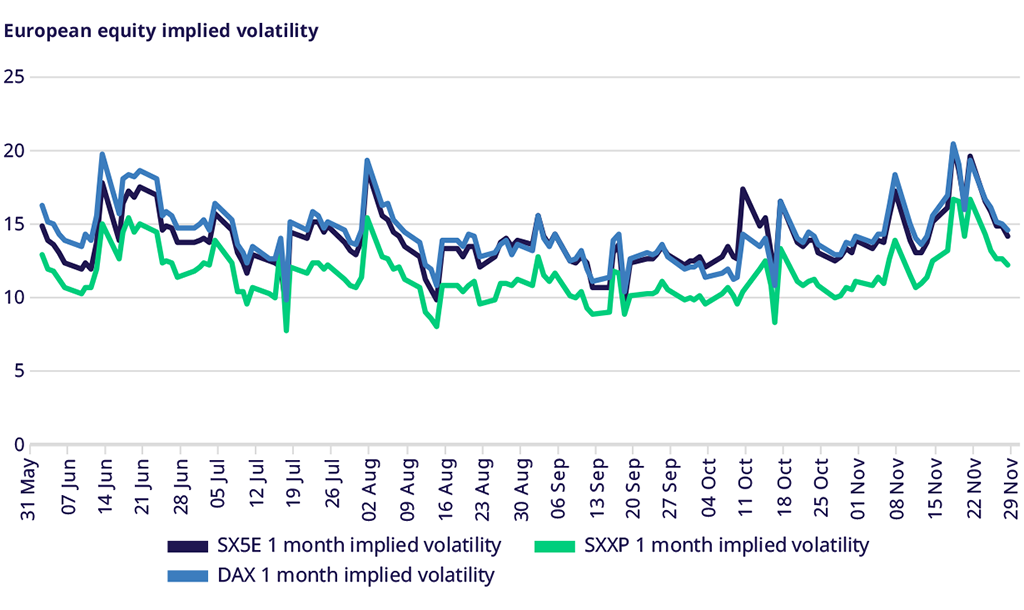
European markets were mixed in November, with the STOXX® 600 leading the way, up 79 bps, EURO STOXX 50® in the middle, up just 11 bps, and DAX Index lagging behind with a decline of 51 bps.
Despite mixed equity indices for the month, implied volatility was higher across the board, with DAX implied up one point, while both EURO STOXX 50® and STOXX 600 were up about 0.3-0.4 points.
After approaching a year’s high of over eight vol points in the middle of the month, skew flattened by the end of the month and was only up modestly at 5.9 vol points, roughly the year’s average.
Implied correlation exhibited a similar pattern, rising to levels not seen since the summer by mid-month, then moderating and ending slightly higher.
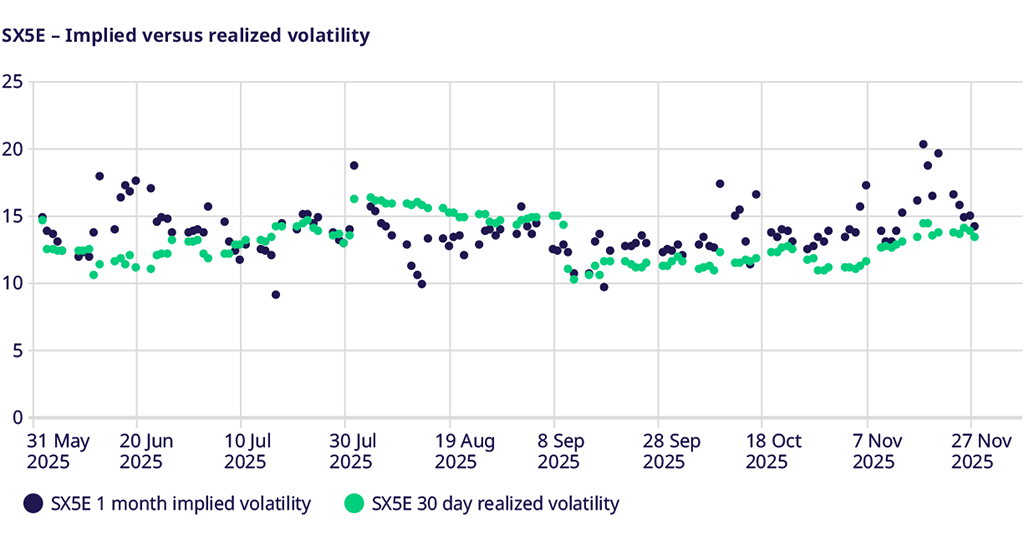
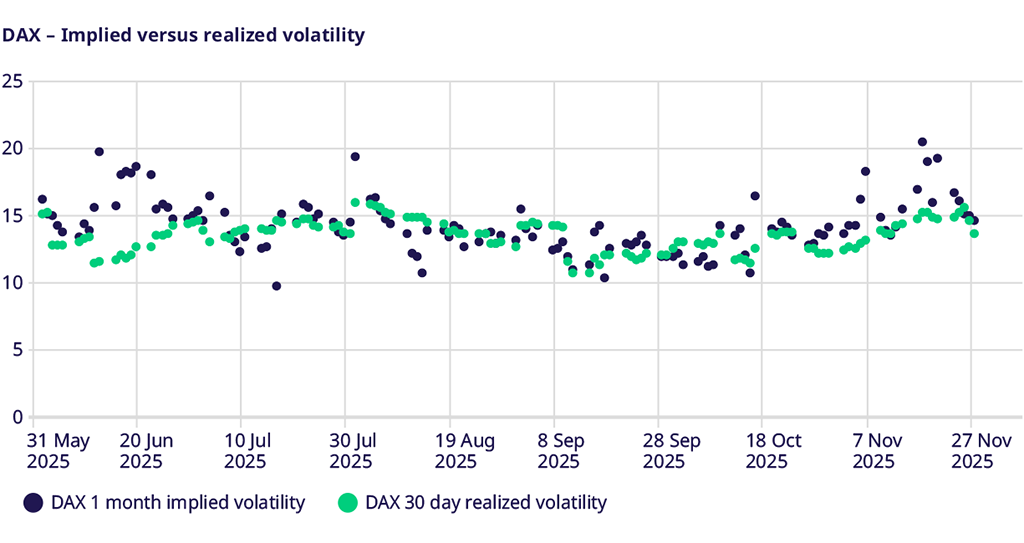
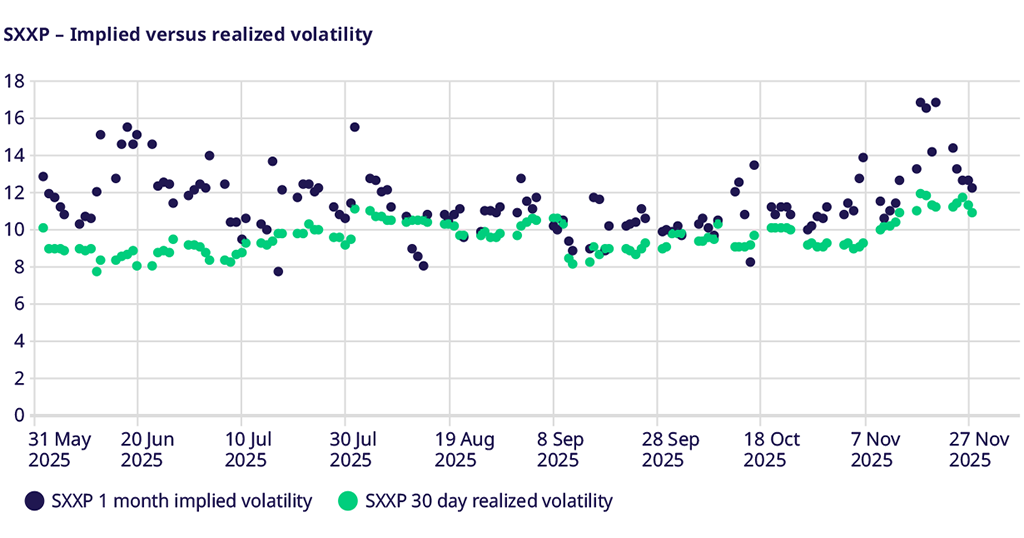
Equity Index Volatility
The AI theme has been a major driver of growth, and when this theme declined during expiration week, the indices followed. As central banks eased fears and fueled optimism for rate cuts, and traders reduced risk ahead of a US holiday, markets rebounded, bringing implied volatility lower. Over the month, EURO STOXX 50® increased slightly from 13.87 to 14.12 but reached a high of 20.36 midway. STOXX® 600 implied rose from 11.13 to 12.19 after peaking at 16.73. DAX moved from 14.19 to 14.62 but peaked at 20.45. The change in implied volatility was not matched by a similar move in realized volatility.
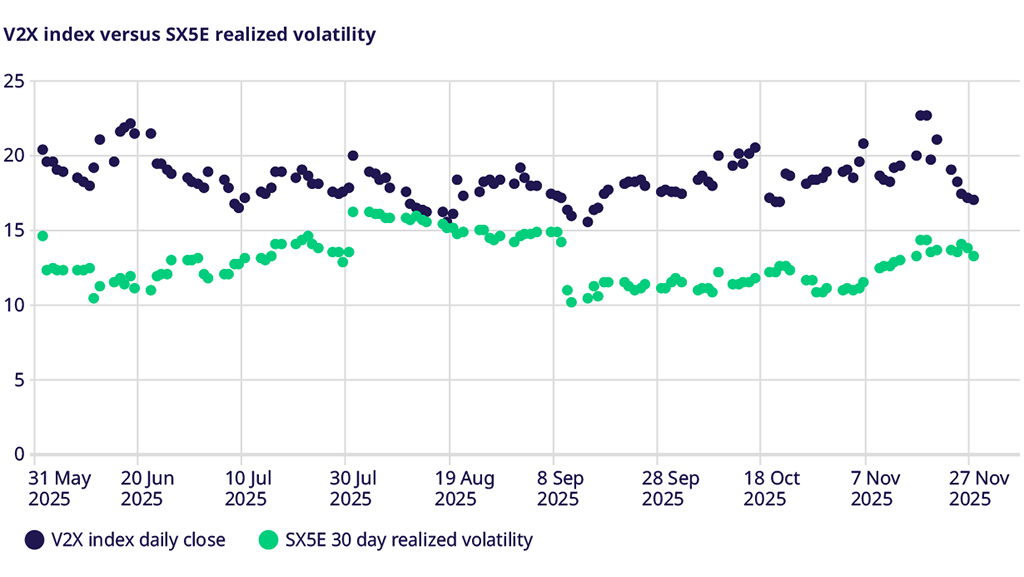
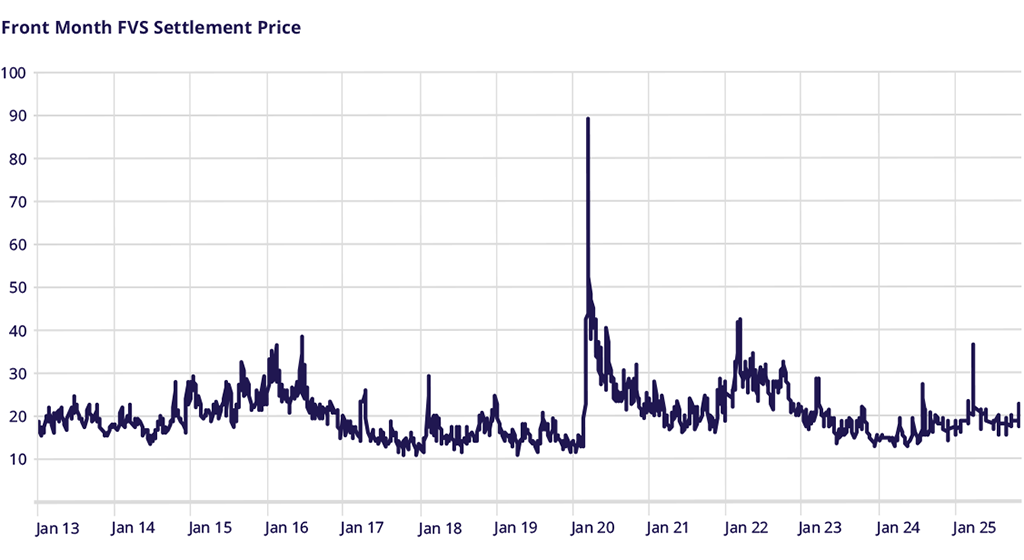
VSTOXX Index Performance
V2X futures opened in November at 19, a 7.5 vol premium to SX5E realized volatility. With the sell-off in indices and a rise in volatility, V2X rose to 22.75 and the volatility premium increased to 8.36 vol points, indicating more nervousness. However, by the end of the month, not only had V2X decreased to 17, but the volatility risk premium had decreased to 3.7 vol points, the lowest risk premium in several months.
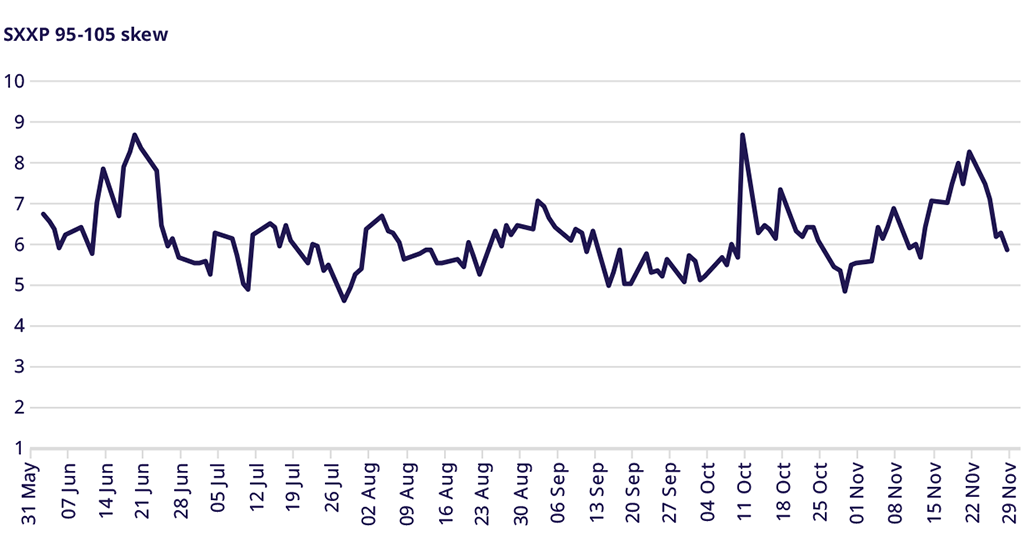
STOXX® Europe 600 Index Skew
The 1-month 95%-105% volatility skew ended October at one of the lowest levels seen this year, near five vol points. Over the course of the month, it rose to eight vols, the highest since the summer, coincident with the market sell-off. By the end of the month, this had reversed, not quite to the lows of October but closer to the year’s average at 5.9 vols. Although it seems like not much happened month to month, there was a significant swing mid-month.
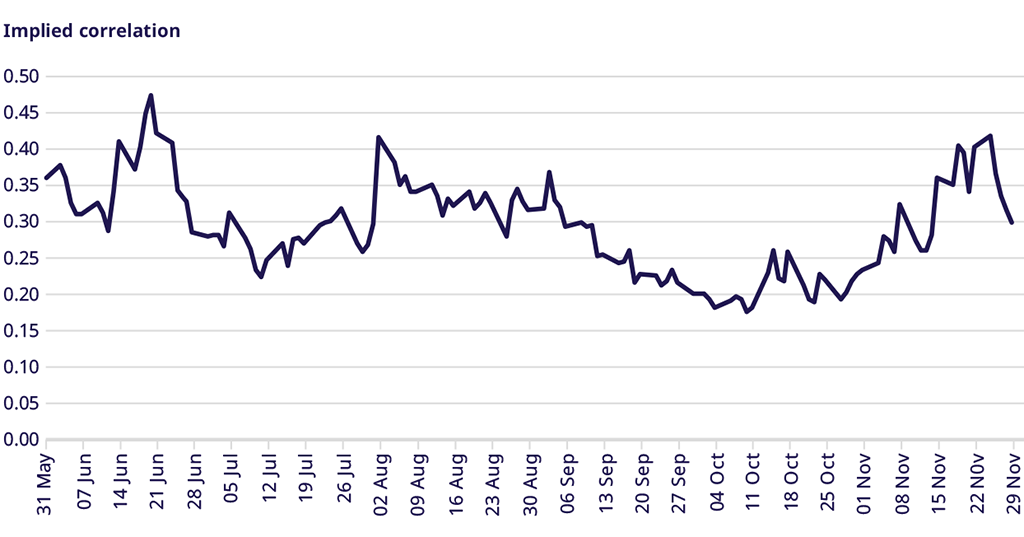
Correlation
Correlation showed the same pattern as vol skew, ending October near 0.2, the lowest of the year, before rising to the highest since the summer at 0.4. With markets recovering and the move away from macro risk, correlation dropped to the average of the last six months, 0.3, by the end of November.
Trade the European volatility benchmark
Explore this year's macro events and find an overview of dates.
VSTOXX 101: Understanding Europe’s Volatility Benchmark
Discover the latest STOXX whitepaper today to learn more about the VSTOXX® core methodology, historical performance analysis, and more.
For more information, please visit the website or contact: