Sep 28, 2023
Eurex
FIC Credit Market Snapshot August 2023
Spreads rise as US curve bear-steepens
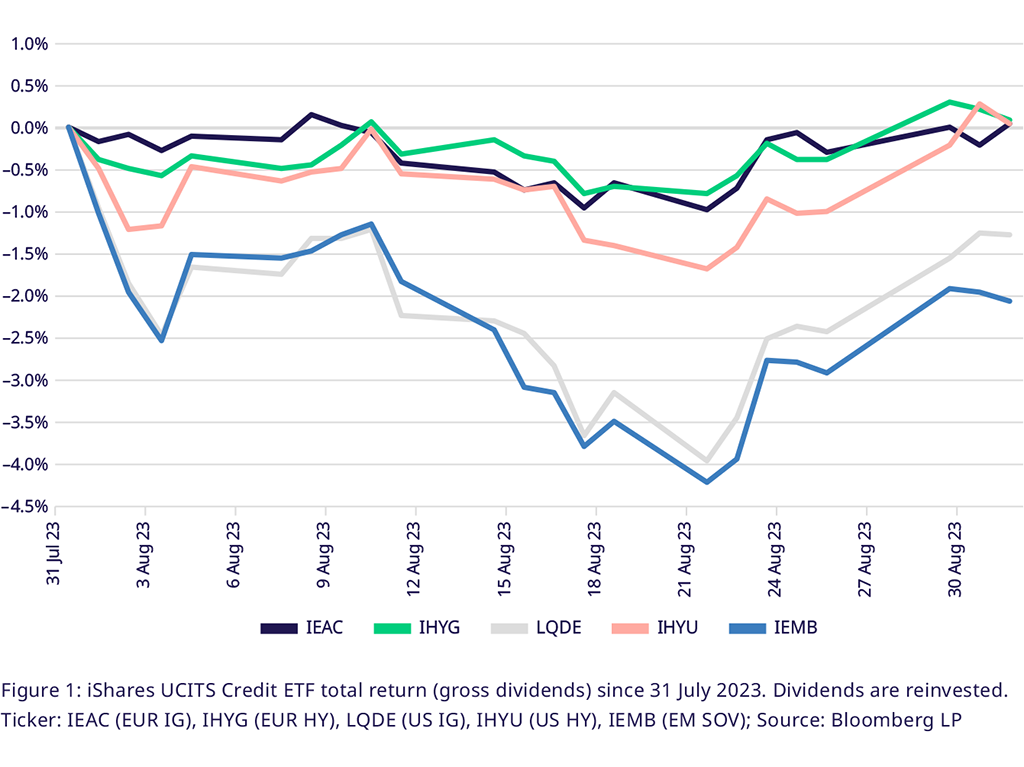
US curve bear steepening drives negative returns for USD denominated long duration Credit UCITS ETFs. IEMB -2%, LQDE -1.2%, IHYU, IEAC, IHYG flat
Amid low trading volumes, August saw credit ETFs realize their carry amid bouts of volatility in both credit spreads and yield curves. However, sovereign curves in the US and Germany behaved in distinct ways, with the US curve bear-steepening, while the German curve further bull-flattened. In the US, the long end of the curve rose a maximum of 28bps over the month, before recovering for a total rise of 14bps in August. The long duration Emerging Markets Sovereign Credit UCITS ETF IEMB and US Investment Grade UCITS ETF LQDE lost 2.05%, 1.27%. The short end of the curve being less impacted and higher carry led to the low duration US High Yield UCITS ETF IHYU staying flat. In Europe, the curve movement supported asset performance, combined with carry from the embedded bonds. However, spreads widened and kept total return flat. Both IEAC (EUR IG) and IHYG (EUR HY) closed the month with a total return of less than 0.1%.
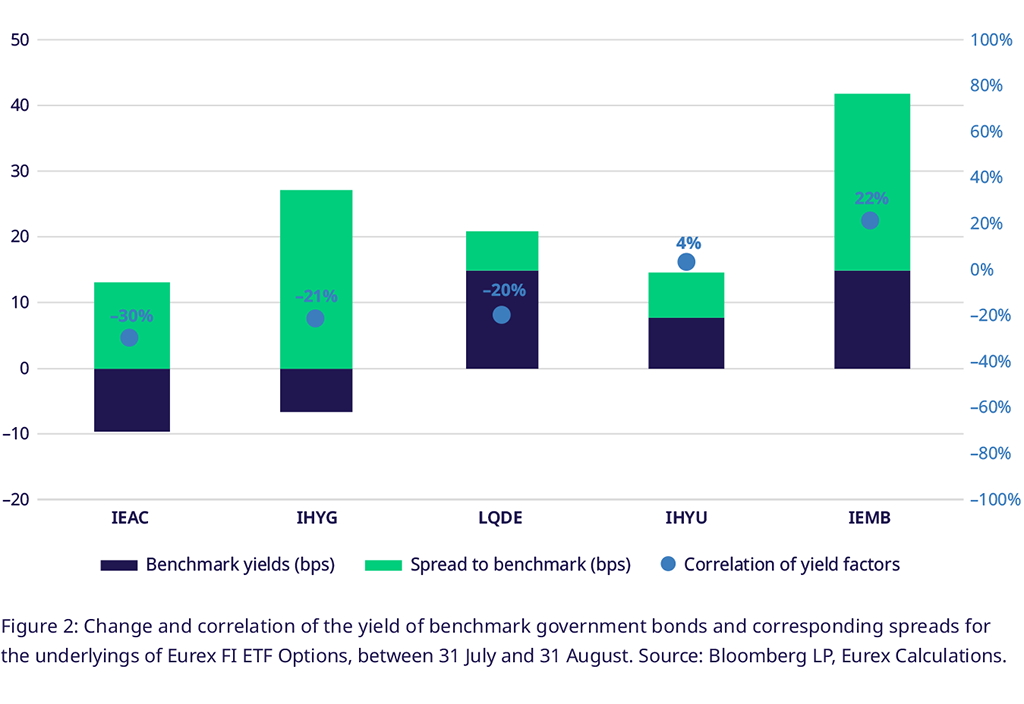
Spreads widen across geographies, domestic US preferred over Europe, Emerging Markets
After a period of continued spread tightening, spreads widened across the board in August. Domestic US credit names saw the lowest spread increases to the respective benchmark government bond, while non-dollar credit ETFs and emerging market saw spreads rise more. Curiously, we saw the total yield change being higher for LQDE, while IHYU was less moved, due to the aforementioned bear-steepening of the curve. Both IHYG and IEMB saw the spread to the yield of the nearest government benchmark security widen by 27bps. IEAC saw spreads rise 14bps.
Spreads rich versus historical average, but EUR Credit ETFs spreads versus Bunds at historic highs
Comparing the average spreads of ETFs vs. the 12-month historical average gives a good indication of how far the market has rallied. All credit ETFs are in rich territory, with long duration US names the richest. LQDE and IEMB have credit spreads -1.38 and -1.17 standard deviations below the historical average, with 2 standard deviations being the common indicator for a pullback. In Europe, the rises in spreads for IHYG and IEAC have reduced some of the previous richness, as spreads ended the month 0.45 and 0.38 below the 12-month average. One thing to keep in mind here is that this period includes the spike in spreads last October, from which we have seen a steady rally.
Spreads against Overnight rates at historic lows, due to deep yield curve inversion in Europe and the US
Break-evens, i.e., the yield-to-maturity over the duration of a bond, indicate how much total return is protected from changes in the yield and credit risk curve. High yield ETFs remain attractive in this metric, given their low duration and high carry. For IHYG and IHYU we have break-evens of 2.80 and 2.14 meaning a yield increase of roughly 280 (214) bps would be necessary to make total returns for the ETF negative. The bear-steepening in the US and German curves that we observe since last year has led to short duration yields rising faster than higher tenors, pushing break-evens of high yield versus longer duration Investment grade. Higher yields baked into bond prices are usually justified by higher volatility expectations, but 90-Day volatility of IHYG and IHYU was actually lower (4.56 vs 5.21) than for IEAC and LQDE, which led to IHYG having the highest break-even per unit of volatility at 67.
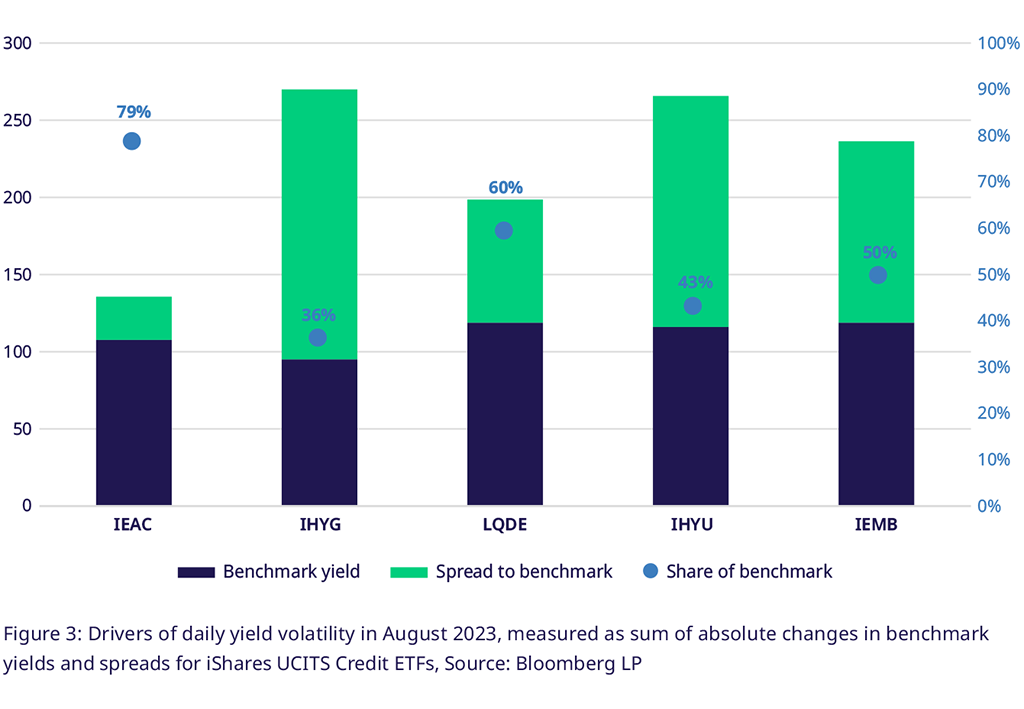
Credit portfolio hedges require duration protection as US curve remains the dominant driver of returns in USD Credit ETFs, spreads dominate for EUR HY
High-duration USD names like IEMB, LQDE, IDTL and IDTM saw returns significantly impacted by changes in the US curve. For LQDE, 60% of the daily yield changes were driven by the benchmark, while 50% were driven for IEMB. In Europe, IEAC saw 79% of its yield changes driven by the curve. IHYG on the other hand was most driven by credit spreads, instead of movement of the sovereign curve, as spreads drove 64% of daily yield movement.
Number of defaults rises in US, Europe but implied vol of credit names historically cheap. Markets price in negative correlation between duration and credit risk in the US
In August we saw four defaults in the US and one in Europe, pointing to continuing default risks stemming from highly leveraged businesses. However, implied volatilities, a measurement of near-term uncertainty, remained cheap compared to historical averages. Throughout the summer, 90-Day realized volatility of credit ETFs printed more than 1 standard deviation below its 1yr average. Similarly, implied volatility has fallen as well, led by IHYU Put Options, which priced in 3-Month 100% Moneyness at 4.7%, more than two standard deviations below the 1-year average. Duration gets priced in as a strong contributor to ETF volatility. US-listed Treasury ETF Options on IEF (IDTM equivalent) priced in implied volatilities of 8.28%, compared to 9.1% for LQDE and 9.87% for IEMB. Looking at the contributions to spread volatility as discussed above, this means that the market is pricing in a negative correlation between the two factors.
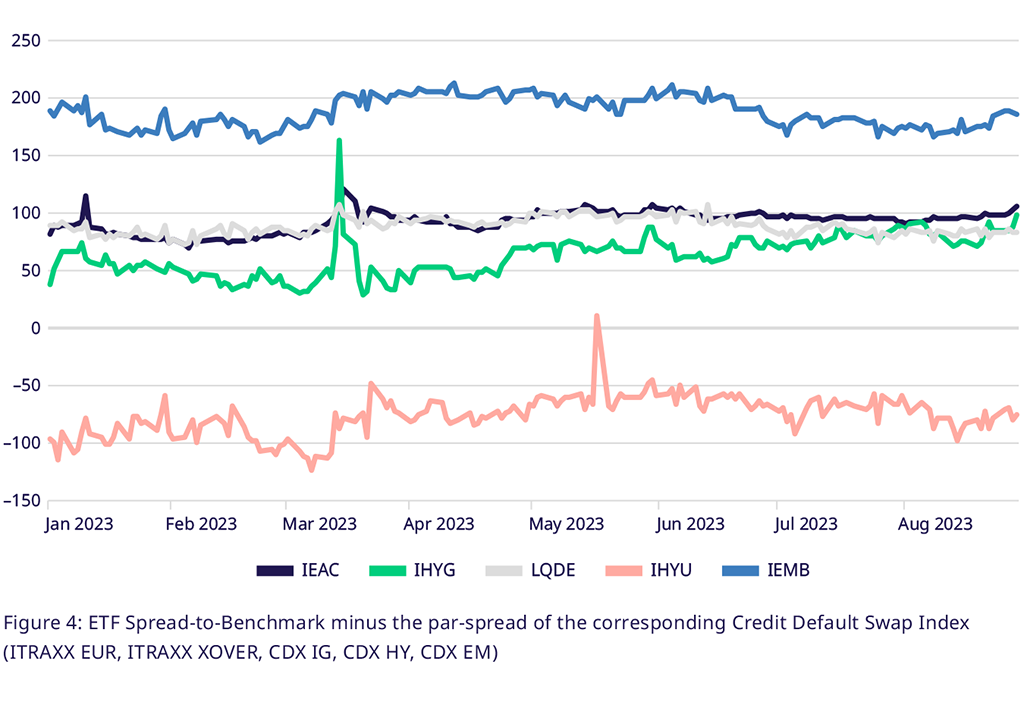
Basis between ETF Credit spreads and CDX spreads falls during the first half of the month, before rising again
Both the average spread of UCITS Credit ETFs and the corresponding CDX par-spread are measurements of broad credit risk in different risk tranches of the economy. The basis between both indicators is varying over time as the ETFs have far more constituents, compared to the CDX, which have a maximum of 125 issuers. A volatile basis against cash portfolios diminishes the hedging capabilities of an instrument. For IHYU and IHYG the basis fell in the first half of August before catching up in the second part of the month. As a trend, the European underlyings IEAC and IHYG have seen the spread differential between the cash and OTC instruments moving up since the start of Q2 2023, while the USD names had the differential decrease.
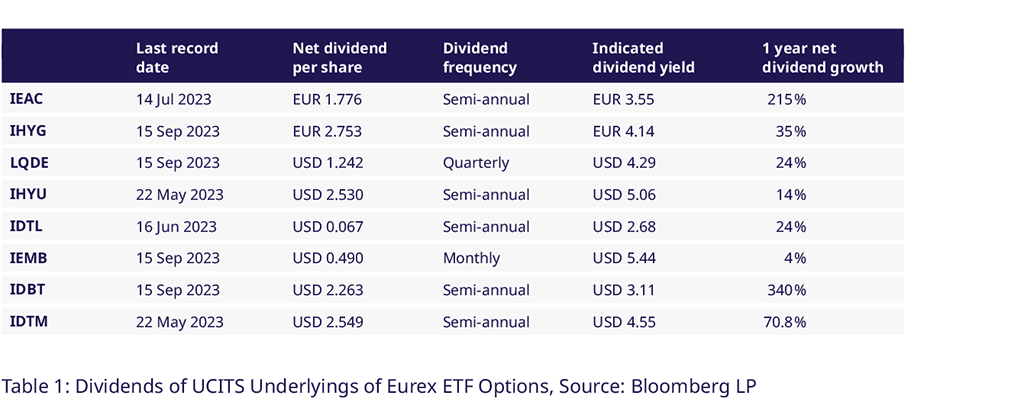
IHYG, LQDE, IEMB, IDBT to pay dividends in September, 340% growth in dividend for IDBT
Short term US Treasuries, as held by IDBT, have seen yields increase the strongest over the last one-and-a-half years. This has led to dividends rising 340% over the last 12 months. Going further out, Eurex Options markets price in a $2.74 dividend per share for IHYU and a $2.77 dividend IDTM in November, which would give an indicated dividend yield of 6.15% and 3.25%.
Utilizing Eurex's Credit Futures & Options for Market Positioning
Eurex Credit Futures and Options enable you to hedge existing portfolios against duration and credit risk in one go. Eurex Options on Fixed Income ETFs allow for directional positioning while limiting options premium paid with options spreads or more tailored option strategies.
Thinking about trading US Interest rates and volatility using UCITS-compliant instruments? Gain exposure to US Treasury markets using the new Options on the IDBT (1-3yr Tenor) and IDTM (7-10yr Tenor) UCITS ETFs., launched on 4 September.
With our Bloomberg MSCI Euro Corporate SRI Index Futures (LXYA index) and Bloomberg Liquidity Screened Euro High Yield Bond Index Futures (AHWA Index), market neutral credit spread trades between EUR IG and HY are now also possible at Eurex.
Contacts