Jul 17, 2023
Eurex | Eurex Clearing
Part 10: Extending margin transparency: option backtesting and margin response to market shocks
Pioneering CCP Transparency Series
Eurex is committed to facilitate industry discussions on margin behavior, margin procyclicality and margin performance. Building and extending on the latest publications, Part 10 of the Pioneering CCP Transparency series provides several backward-looking as well as forward-looking disclosures:
- Backward-looking:
Updated product-level backtesting and procyclicality results for the list of products covered in Part 8 (Listed Futures and OTC Interest Rate Swaps)
Presentation of backtesting results of option products on a time window starting from January 2020, encompassing Covid crisis (2020), invasion of Ukraine (2022) and interest rate market developments (2022). - Forward-looking: Hypothetical margin simulation as a response to potential future events:
Updated simulations of Prisma margins to a replay of Lehman (2008), Covid (2020) and Ukraine (2022) crises over a period of 6 months.
Newly added component: simulation of margin response over 10 business days to a single market shock of various magnitudes.
Product level backtesting
The first bulk of this note provides product-level backtesting margin figures as well as backtesting and procyclicality metrics, extending the results published in Part 8 to 30th June 2023.
The file package accompanying this publication contains details on formulas used for the backtesting and procyclicality metrics.
The Prisma initial margin model achieves an effective confidence level beyond the target level of 99% and 99.5% for listed and OTC instruments, respectively. An aggregated view by asset class and on a 3-year window is provided in Table 1. The attached dataset allows the reader to navigate through the key performance indicators (KPIs) for each individual product.
| Average of KPIs across asset class on the 3Y window | |||||
Metric | Ex-Post Coverage | Loss-to-Margin ratio | 1-day MRIM increase | 5-day MRIM increase | 10-day MRIM increase | Peak-to-trough ratio |
Asset class |
|
|
|
|
|
|
Listed Equity Index Derivatives | 99.98% | 115% | 12% | 30% | 40% | 81% |
Listed Fixed Income Derivatives | 99.92% | 126% | 21% | 41% | 56% | 170% |
Listed FX Derivatives | 99.97% | 112% | 9% | 15% | 22% | 58% |
OTC Swaps | 100% | - | 16% | 45% | 51% | 339% |
Backtesting of options
Part 7 and Part 8 of the Pioneering CCP Transparency have set the ground for the evaluation of the performance and procyclicality of the initial margin model by introducing standardized backtesting as well as anti-procyclicality metrics. The product scope of these past articles are Listed Futures and OTC Interest Rates Swaps (OTC IRS). Part 10 builds on the previous structure and introduces backtesting of plain vanilla options.
A backtesting exercise requires the definition of a method when rolling the position over time. There are different approaches that one may employ, for example:
- choosing a specific contract and keeping it fixed throughout the backtesting window (buy and hold)
- defining a precise trading strategy that is initiated every business day going back in time aiming to keep a fixed risk profile
The former provides limited value in terms of options back-testing. Over time, the risk profile of a given option typically drifts into either in-the-money or out-of-the-money. Consequently, the variability of margins over time is dominated by change in option risk profile, rather than revealing useful information about the margin model.
For Listed Futures and OTC IRS the approach is to back-test the front-month contract and ATM Swaps of various maturities, respectively. When it comes to option products, an increased level of detail is required when specifying the backtesting strategy since options display not only a time-to-expiry dimension but also a strike dimension. For that reason, the implementation chosen in this exercise is to fix an option risk profile over time.
In Part 10 of the Pioneering CCP Transparency we select top option products listed at Eurex with several risk profiles built by combining:
- Call and put options
- with Time-to-expiry of 1 month, 3 months and 1 year
- and strikes corresponding to a moneyness of 1 to resemble ATM options (with moneyness calculated as the ratio of underlying over strike).
Having defined the option risk profiles in scope of the back-test, instrument selection is performed out of the option series instruments available for trading at Eurex to concretely pick the traded instrument which most closely matches the risk profile for each business date in the backtesting window.
In this respect, there are once again more alternatives with respect to how the backtesting exercise can be conducted:
- Choose listed instruments with characteristics most closely matching desired risk profile
- Choose instruments that can be flexibly generated by varying strike or expiry to more accurately match intended risk profile.
On the one hand, on-exchange options are listed on pre-defined maturities and with non-continuous strike ranges which makes it difficult to attain an exact target level of time-to-expiry and target level of moneyness. In this case, the approach is to select the on-exchange option which best mirrors the desired trading strategy. This implies that the on-exchange option might vary day by day due to passage of time and changes in the underlying. The margin time series might also be affected by an occasional maturity roll.
On the other hand, Eurex also offers flexible options. These are off-book products where trading participants can design additional contract versions by selecting, for instance the expiration date and the exercise price, and as such meet the desired level of time-to-expiry and moneyness.
In this article, backtesting results using the former approach are presented since on-exchange options have a transparent price discovery mechanism in an orderbook and publicly available settlement prices.
The backward-looking part of this publication is prepared for key Eurex option products (OESX, ODAX, OGBL, OBTP) and encompasses:
- An Excel worksheet (“Option_backtesting_disclosure.xlsx”) including disclosure of margin figures and related backtesting and procyclicality metrics for each option backtesting strategy. The maturity and strike of the option that best resembles the desired level of time-to-expiry and moneyness are detailed for each backtesting strategy and for every business date.
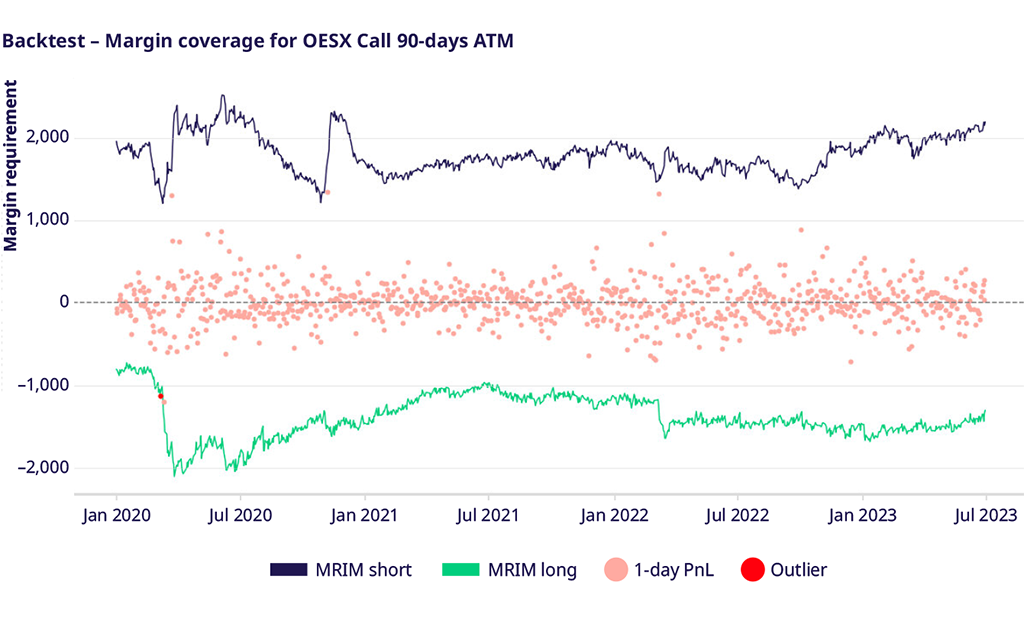
- Time-series charts (such as Figure 1 below) which depict the coverage of Market Risk Initial Margin (MRIM) against 1-day mark-to-market PnLs .

Procyclicality analysis of options
Analyzing the margin evolution and the corresponding procyclicality metrics of certain risk profiles one notices values that indicate high variability in margin figures, including large short-term procyclicality. This needs to be interpreted in relation to the backtesting approach mentioned above. Daily rebalancing of standard listed instruments means that the option contract reflecting the trading strategy might be different across dates due to the passage of time and changes in the underlying. While the goal is to maintain the risk profile through time, even small variation in moneyness or time-to-expiry can naturally cause changes in margins when one moves from a certain strike to the other or from a certain expiry to the other.
To put things into perspective and provide a different angle on the topic, it is important to provide more details on how procyclicality is defined within the risk framework of Eurex Clearing. Procyclicality of initial margin is its variability originating from the model-induced perception of the risk of an instrument or portfolio of instruments. The model specific impact represents the change in initial margin that can be attributed to the risk model only. This means that effects resulting from changes in the portfolio, moneyness drift over time due to market level changes, or any life-cycle events such as expiries are to be excluded. As such, this stricter measurement of procyclicality should be performed by applying as much as possible the following guiding principles:
- Constant exposure without noise induced by re-balancing
- The base market levels should be kept static to avoid impact of market drift on moneyness
- The characteristics of the portfolio shall be frozen (fixed time-to-expiries, no life-cycle events)
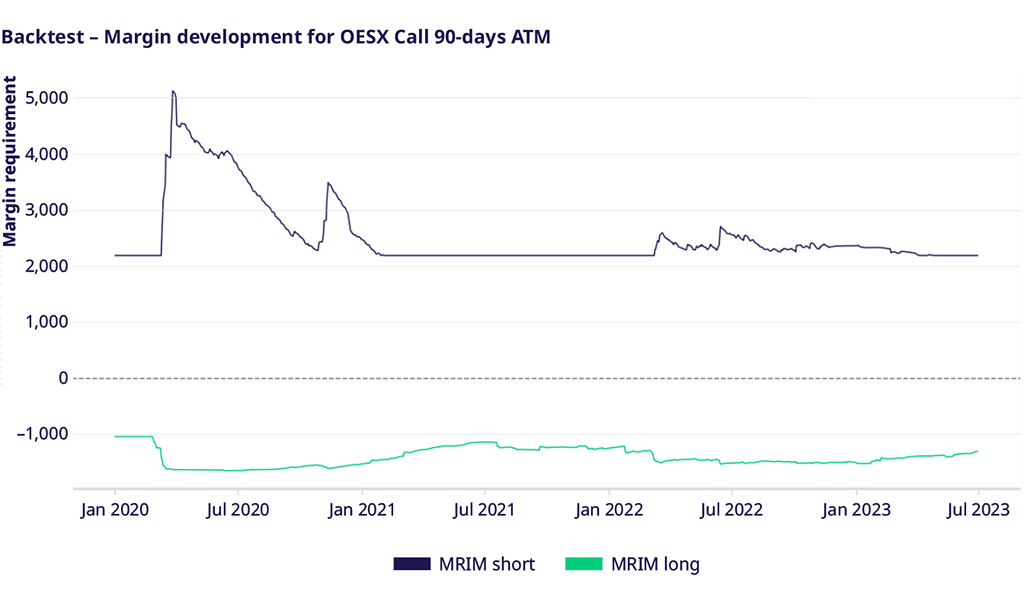
The backtesting approach and related model KPIs introduced in the previous section provide an insight into productive margin figures and allow market participants to have an appreciation of the output of the Prisma Initial Margin model when applied to listed option contracts. At the same time, some of the guidelines above cannot always be met as, for instance, base market levels do vary, and the constant exposure is only approximated by the instruments listed on the exchange due to non-continuous strike ranges and discrete expiries. For this reason, a supplementary backtesting approach is presented and published. In this instance, the option contract that best approximates each trading strategy presented earlier is chosen as of 30th June 2023. Then, the portfolio characteristics, the base market data and the initial margin model parametrization are frozen as of the same date such that the backtesting exercise is rolled out in the past considering only the dynamics over time of the underlying risk factors. For this purpose, a second Excel worksheet (“Option_backtesting_disclosure_FixedPortfolioBacktest.xlsx”) is provided with the same format as the one introduced earlier.
Figure 1 above depicts the margin development of a 90-day ATM option risk profile for OESX calculated using daily rebalancing of on-exchange options. The model specific impact on the evolution of the margin requirement is instead illustrated in Figure 2. The difference between the two graphs allows to gauge the effect that changing market levels, portfolio rebalancing or life-cycle events can have on the resulting margins. One may also notice a flat margin evolution on certain time windows. This is due to freezing also the model parametrization besides the above-mentioned characteristics.

Response of margins to market shock
The evolution of margin requirements into the future following a market event has gained importance following the recent crises, which brought the performance and procyclicality of risk models to the forefront of industry discussions.
In Part 8 of the Pioneering CCP Transparency Eurex introduced a historical replay analysis of margin sensitivity to crisis scenarios. We have taken actual time series of daily returns from historical crises and applied them to a recent reference date to simulate what would happen to the margins if one of the past crises happened again. This is long-term simulation of margin evolution over 6 months capturing not only a single largest market shock but also build-up and aftermath. In this publication we provide updates of these simulations with a recent reference date. The Excel file Product_margin_simulation_disclosure_Q3_2022.xlsx discloses the product level margin simulation figures as well as APC KPI metrics for Eurex benchmark products, which help to gauge potential market variability.
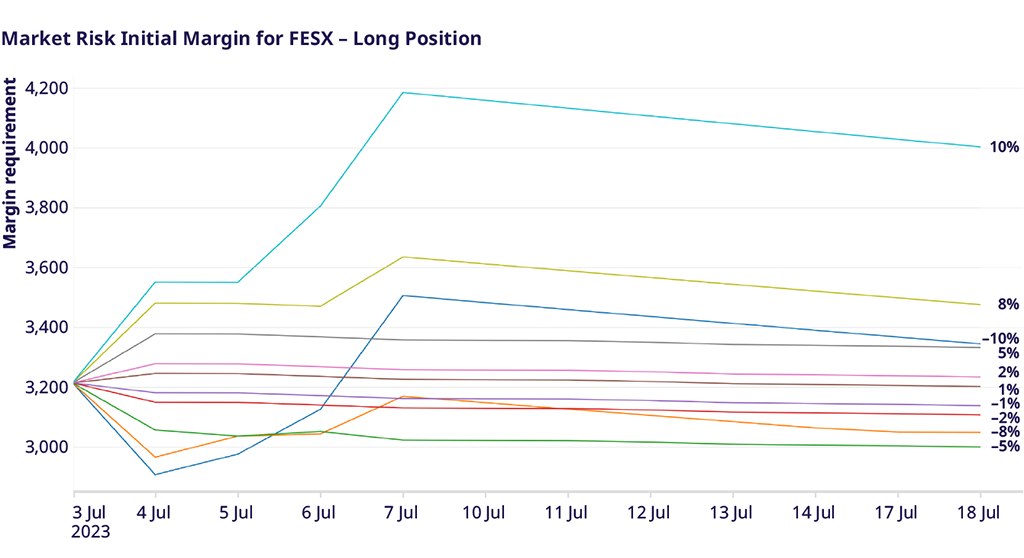
A similar and valid question is to ask how margins react to a single market shock scenario and how it affects margin levels over the ensuing few days. To achieve this, we apply 1-day shocks to the market of varying magnitudes: for Exchange Traded Derivatives from –10% to +10%, while for OTC IRS the market shocks range from –100bps to +100bps. Margin simulation is then continued for further two weeks assuming zero shifts in market variables to replicate a calm market environment. This simulation provides insights about the potential liquidity needs arising from increase in initial margin in case of a market shock of a given size.
In line with the structure presented so far for the other disclosures, the Excel file Product_margin_response_disclosure_Q2_2023.xlsx provides the simulated margin requirements for each respective product under the various market shocks. Plots such as Figure 3 accompany the disclosed data and illustrate graphically the potential changes in margin requirements.

Contents of extended transparency publication
The bulk of this publication is a package of materials in a zip file. The package contains the following Excel files:
- Product_backtesting_disclosure_Q2_2023.xlsx: updated product level backtesting for Listed Futures and OTC Interest Rate Swaps
- Option_backtesting_disclosure_Q2_2023.xlsx: backtesting and procyclicality results for plain vanilla options
- Option_backtesting_disclosure_FixedPortfolio_Q2_2023.xlsx: backtesting and procyclicality results for plain vanilla options with the alternative approach of freezing portfolio characteristics and base market levels
- Product_margin_simulation_disclosure_Q2_2023.xlsx: updated historical replay analysis of margin sensitivity to crisis scenarios
- Product_margin_response_disclosure_Q2_2023.xlsx: margin response to market shocks of various magnitudes
