Aug 09, 2022
Eurex | Eurex Clearing
Part 8: Forward looking margin simulations into periods of stress
Pioneering CCP Transparency Series
Eurex is committed to facilitate industry discussions on margin procyclicality and margin performance. In this latest part of the Pioneering Transparency series, several disclosures are provided:
- The disclosure of key procyclicality and back-testing metrics for benchmark products with a reference date of 30th June 2022 and a backtesting window of 1 year and 3 years
- Simulation of future margin behaviour assuming a replay of historical scenarios in both calm as well as volatile baseline
Product level backtesting
The first disclosure builds upon the preceding Part 7 of the series, where product-level backtesting results were published along with backtesting and procyclicality metrics. Eurex presents updated results as of 30th June 2022 as well as:
- An extended list of products covered from the original 10 to 24
- A worksheet with example calculations, including product margin figures and implementation of formulas for metrics applied to ensure a common understanding
- Over-time charts (such as Figure 1 below) which depict the Market Risk Initial Margin (MRIM) coverage against 1-day realized PnLs
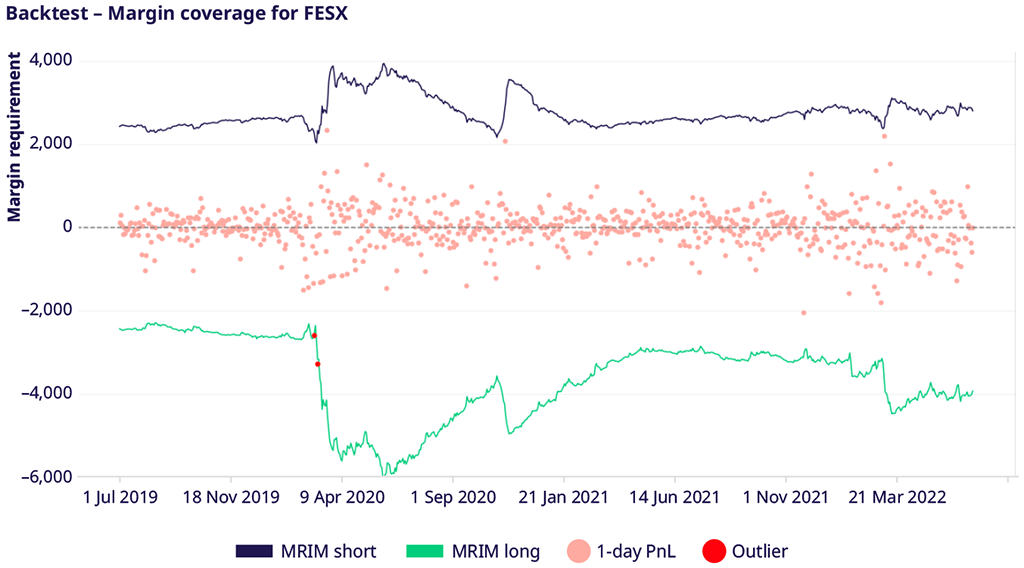
Figure 1
In terms of backtesting, the Prisma margin model achieves an effective confidence level beyond the target confidence level of 99% and 99.5% for listed and OTC instruments, respectively. An overview of backtesting and procyclicality metrics aggregated by asset class and on the 3-year window is provided in the table below. The attached data set allows the reader to navigate through the key performance indicators (KPIs) for each individual product and each lookback period.
| Average of KPIs across asset class on the 3Y window | |||||
Metric | Ex-Post Coverage | Loss-to-Margin ratio | 1-day MRIM increase | 5-day MRIM increase | 10-day MRIM increase | Peak-to-trough ratio |
Asset class |
|
|
|
|
|
|
Listed Equity Index Derivatives | 99.92% | 112% | 17% | 46% | 63% | 136% |
Listed Fixed Income Derivatives | 99.79% | 130% | 24% | 55% | 86% | 141% |
Listed FX Derivatives | 99.97% | 125% | 13% | 23% | 35% | 59% |
OTC Swaps | 100% | - | 17% | 50% | 56% | 232% |
Product level margin simulation
The second disclosure in this part of the series consists of a completely novel approach to margin simulation. Eurex already offers a publicly available estimator for hypothetical portfolios for both current and historical valuation dates. This, however, does not address questions about how margins may evolve in the future. First, the future is uncertain, and so is market volatility and consequently margins. However, what the CCP can do is provide additional transparency on how will margins behave subject to a given certain market scenario.
Eurex Clearing Prisma model re-calculates the margins based on new data as it arrives. A simple approach to margin simulation would answer the question of ‘how will margin change if the market moves by x %’. This is a valid question but only part of the story, as typically, market scenarios play out over several days or weeks, and thus how margin changes over a longer period than a day is often more useful. For that reason, Eurex has designed entire market data scenarios which are played out over a period of 5 to 6 months. A market participant can then observe how margins would evolve over that period given a specific scenario.
The calculation is performed for two reference dates: 30th November 2021 to simulate impacts where the baseline is a calm market environment and 30th June 2022 to simulate impacts during periods of higher volatility. The simulated scenarios include:
- Replay of Lehman crisis from 1st September 2008 until 2nd March 2009
- Replay of Covid crisis from 1st January 2020 to 1st July 2020
- Replay of Ukraine crisis from 1st February 2022 to 30th June 2022 (only applied to 30th June 2022 reference date)
How is the historical replay achieved? The base assumption is that the relative returns of prices of futures contracts on each consecutive day following the respective reference date are the same as the relative returns of the historical period being replayed. These returns are then sequentially applied to the price of the front futures contracts at the reference date, thus creating a simulated price and return time series into the future. For each date into the future from the reference date, Market Risk Initial Margin is calculated.
The replay of historical returns allows the reader to better study margin behavior from multiple dimensions:
- Across two different reference dates presenting differing volatility regimes. The margin model exhibits lower procyclicality when the starting point is a volatile one. In a market cycle where volatility is already elevated, margin levels already reflect a high volatility regime at the reference date. In contrast, margins “have more space to move” when volatility is yet to materialize. This can be visualized in Figure 2, where the difference in margin evolution can be observed for FGBL when playing out the Covid crisis scenario for the two reference dates. Note the PnL dots show the same shape.
- Across different scenarios. Each crisis may have impacted the financial system differently, e.g. from an asset class, duration and magnitude point of view.
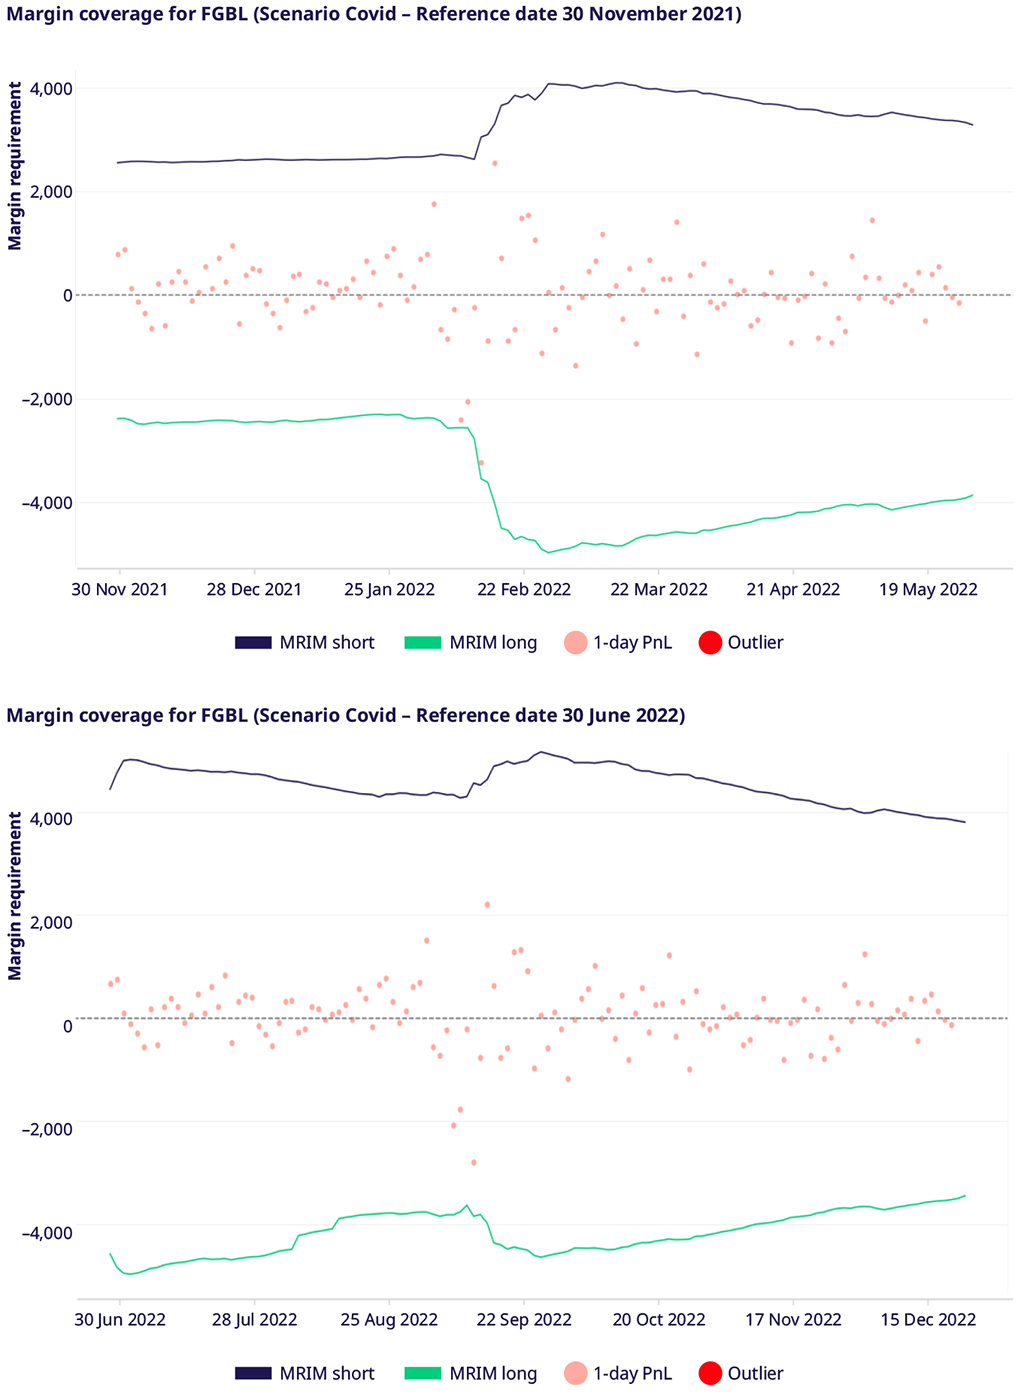
Figure 2
Contents of enhanced transparency publication
The bulk of this publication is a package of materials in a zip file. The package contains:
- An excel file (Product_backtesting_disclosures_Q2_2022.xlsx) with a disclosure of product level back-testing and anti-procyclicality (APC) KPIs over the past one year and three years. The file contains a worksheet for summary KPI metrics for 24 benchmark products, a worksheet where calculation of KPI metrics is presented with an example time series and a worksheet with all margin time series. The margin time series allows readers to calculate their own custom KPIs, if desired.
- An excel file (Product_margin_simulation_disclosure_Q2_2022.xlsx) with a disclosure of product level margin evolution simulation for benchmark products. The file contains a worksheet with APC KPI metrics for benchmark products under all previously described scenarios and evaluation dates. The spreadsheet also contains one worksheet per product containing simulated time series for margins for respective products under different scenarios.
- A folder (plots) with plots for each product depicting margin evolution under various scenarios, thus graphically representing the data from the excel files.
Key Performance Indicators (KPI) of the performance of the margin model
The remainder of this publication explains the KPIs used for backtesting and to measure procyclicality.
Backtesting metrics
Backtesting is an ex-post check whether the model predictions are in line with the realized data. The following metrics are calculated:
- Number of breaches: represents the times where the realized product PnL marked losses exceeding the margin.
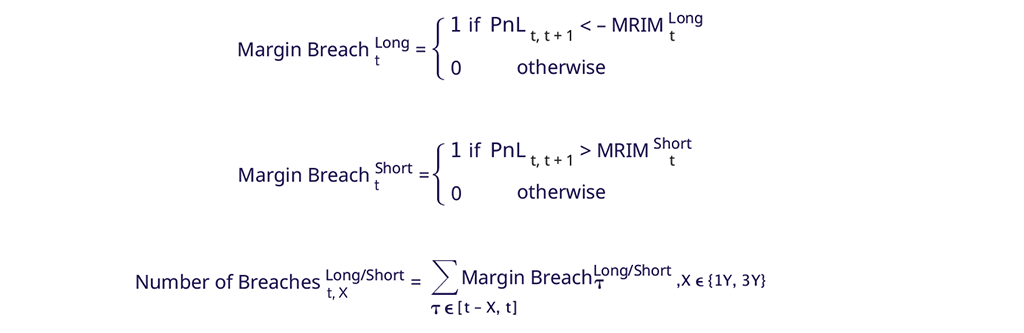
- Ex-Post Coverage: denotes the portion of observations where the margin was sufficient to cover the realized PnL.

- Loss-to-Margin Ratio: The metric measures the proportion by which the PnL exceeded the margin requirement.

Procyclicality metrics
Procyclicality is the tendency of a variable to move in line with the cycle. Under this definition, the procyclicality of the margin model due to changing market conditions is analyzed and measured with the following metrics:
- Maximum relative margin increase: this is a short-term procyclicality metric and can be regarded as the largest margin call that would have been issued by Eurex Clearing during an n-day time window. It is calculated as:

- Peak-to-trough: this is a long-term procyclicality metric and can be viewed as the long-term funding uncertainty due to changes in margin requirements resulting from model procyclicality. It is defined as:
