During the market turbulences in Q2 2022, Prisma achieved the target confidence level in portfolio backtesting across all asset classes, as reported within the Q2 2022 CPMI IOSCO disclosure.
Nevertheless, increasing volatility due to the Ukraine crisis and a sharp increase in interest rates caused more individual margin breaches in Q2 2022 compared to Q4 2021. Reported effective confidence levels remain firmly above their target level considering a 1-year lookback period as shown in Figure 1 below, even in the recent volatile market environment (see metric 6_5_3 from the CPMI-IOSCO disclosure).
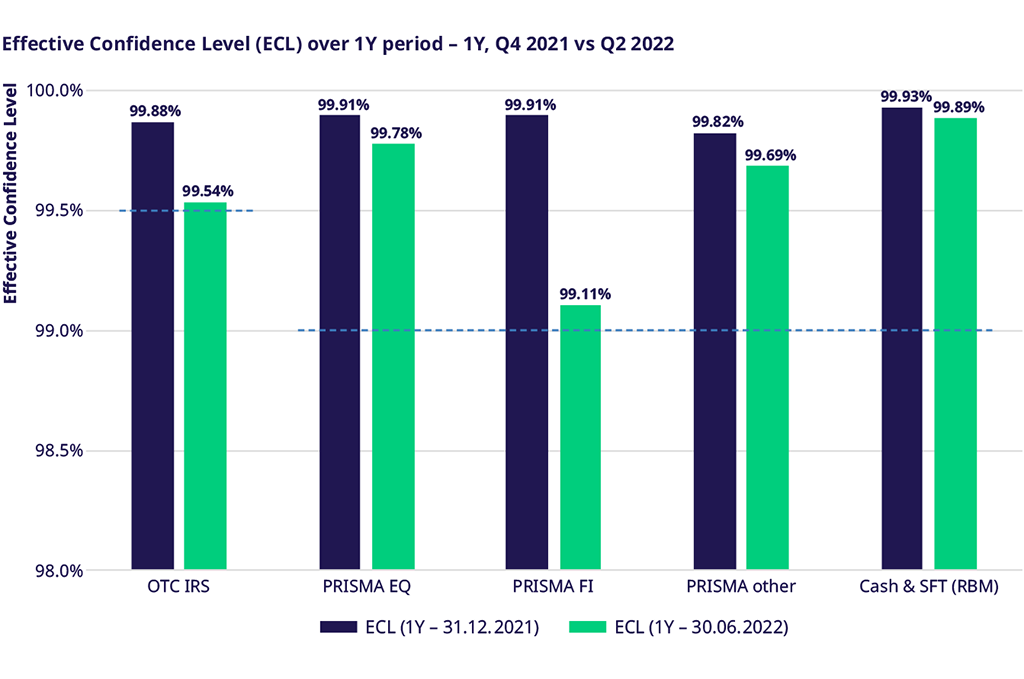
Figure 1: Effective Confidence Level by Asset Class and over 1Y period (Q4 2021 disclosure vs Q2 2022 disclosure), target confidence levels marked by the dashed blue line.
In detail, the subsequent sections cover the following:
- Interpretation of portfolio backtesting results, in particular considering the purpose of the backtesting approach.
- Insights into analysis results related to the EUR 706 mn margin breach observed between February 25th, 2022, and March 1st, 2022, caused by a “Flight to Quality” market move on Fixed Income markets in the beginning of the Ukraine crisis.
Eurex Clearing’s portfolio backtesting approach – assessment of model performance vs. view on available resources
Naturally, the portfolio backtesting metrics reported as part of the CPMI-IOSCO (metrics 6_5_1_1, 6_5_3, 6_5_4 & 6_5_5) depend on the underlying portfolio backtesting approach.
The main objective of Eurex Clearing’s internal portfolio backtesting approach is to assess the model performance of the underlying margin model. For this reason, Eurex Clearing only assesses the market risk component of the initial margin in portfolio backtesting, excluding add-ons for liquidity- and concentration risk. Further, backtesting is done against MPOR-day realized P&Ls consistent to the holding period assumed in the margin models. While using this setting for the PQDs on the assessment of the margin model’s backtesting performance, we believe it is worth noting two points:
- first, the setting does not reflect that there are further available resources. Specifically margin add-ons are not included.
- second, the setting may not be comparable to settings used at other CCPs, which may use backtesting results comparing initial margin values including all add-ons against realized P&Ls over different time horizon, e.g., 1-day.
To illustrate the impact and enhance transparency and comparability, the table below summarizes margin exceedances - both in absolute EUR and relative terms - related to the EUR 706 mn margin breach contrasting different backtesting approaches. Considering for example the entire initial margin including add-ons in comparison to 1-day P&Ls, available resources would have covered the breach of EUR 706 mn.

Table 1: Margin exceedance in absolute (EUR) and relative terms depending on backtesting approach (Fixed Income ETD portfolio, with reported EUR 706 mn breach between February 25th, 2022, and March 1st, 2022).
For better illustration of the impacts of the portfolio backtesting approach on reported metrics, the charts below show margins in-/excluding add-ons over time,
- against 2-day P&Ls in line with the MPOR for Fixed Income ETD portfolios in Figure 2 and
- against 1-day P&Ls in Figure 3.
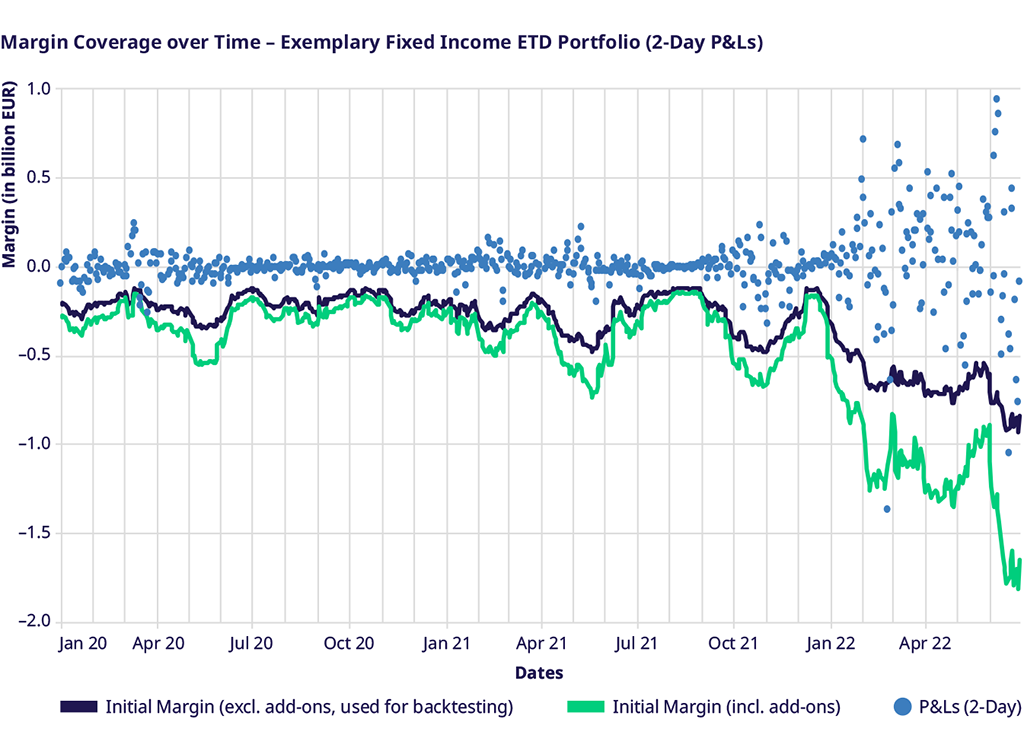
Figure 2: Margin Coverage over time - Exemplary Fixed Income ETD portfolio considering margin excluding add-ons (blue) and including add-ons (green) against MPOR-day (2-day) P&Ls.
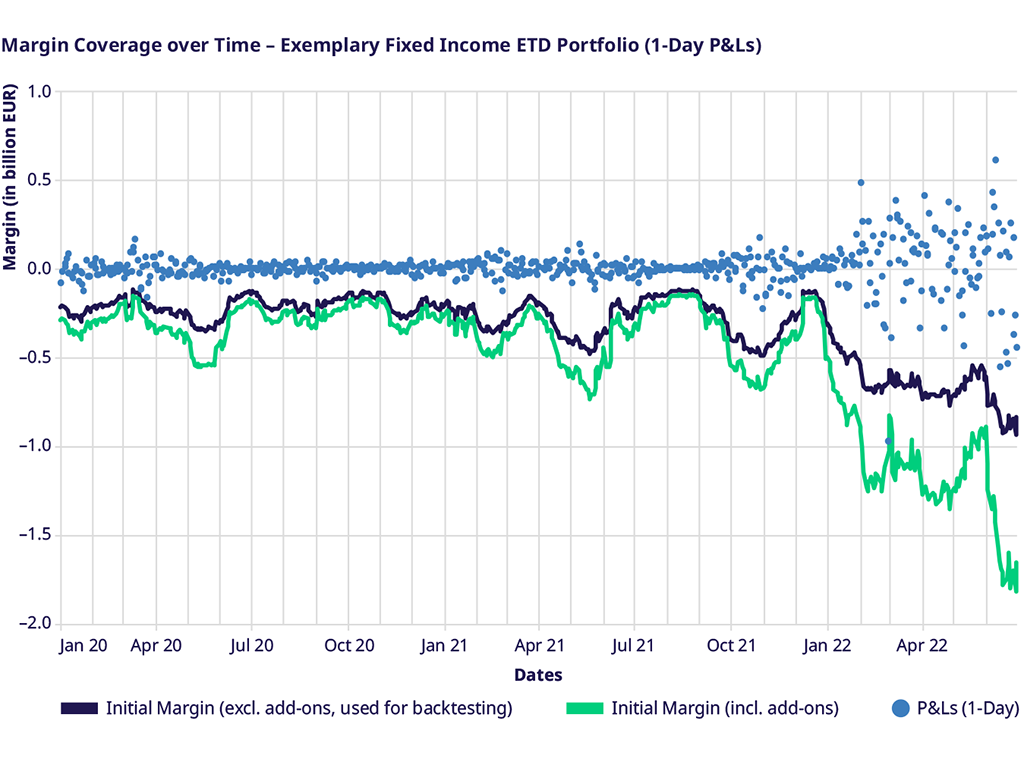
Figure 3: Margin Coverage over time - Exemplary Fixed Income ETD portfolio considering margin excluding add-ons (blue) and including add-ons (green) against 1-day P&Ls.
Analysis of Fixed Income ETD outliers in Q1 2022 caused by “Flight-to-Quality” market move
Considering Eurex Clearing’s internal portfolio backtesting approach as described above, this section provides further insights into the EUR 706 mn margin exceedance recorded for a Fixed Income ETD portfolio between February 25th, 2022, and March 1st, 2022.
The portfolio backtesting outlier was driven by a “Flight-to-Quality” market move observed on fixed income ETD markets in the beginning of the Ukraine crisis. Considering portfolio composition, the portfolio exhibited a directional, short exposure in Government Bond Futures. 98% of the portfolio loss was driven by short positions in German-, Italian- and French Government bond futures, while remaining positions only had a minor impact on the overall portfolio P&L. Other Fixed Income ETD portfolios showed comparable behavior over the same time horizon.
Considering the market move in settlement prices of benchmark Government bond futures causing most of the losses on a portfolio level, it can be observed that MPOR-day settlement price returns in front-month future contracts are exceeding the 99% quantile of preceding 3-year return time series in all cases. Partially returns are even exceeding the maximum 2-day return observed across the preceding 3Y period (see Table 2 below).

Table 2: 2d-returns in settlement prices for front-month contracts between February 25th, 2022, and March 1st, 2022, compared to preceding 3Y return history.
The severity of the observed “Flight-to-Quality” market moves in benchmark Government bond futures becomes clear when considering backtesting results on a single product level. As one example, Figure 4 depicts backtesting results related to a short front-month position in the FGBM. For the period between February 25th, 2022, and March 1st, 2022, under consideration a margin exceedance for a short FGBM front-month future contract can be observed with a relative loss-to-margin ratio of 2.08. The relative size of margin exceedances for benchmark Government bond futures on a product level (e.g., loss-to-margin ratio of 2.08 for the FGBM) is comparable to relative margin exceedances reported on a portfolio level (e.g., loss-to-margin ratio of 2.07 for the exemplary Fixed Income ETD portfolio level margin breach as depicted within Table 1.) For completeness, Figure 5 depicts product level backtesting results for a short FGBM front-month contract against 1-day returns. While one can still observe a margin exceedance between February 28th, 2022, and March 1st, 2022, in this case, the exceedance relates to a lower loss-to-margin ratio of 1.39.
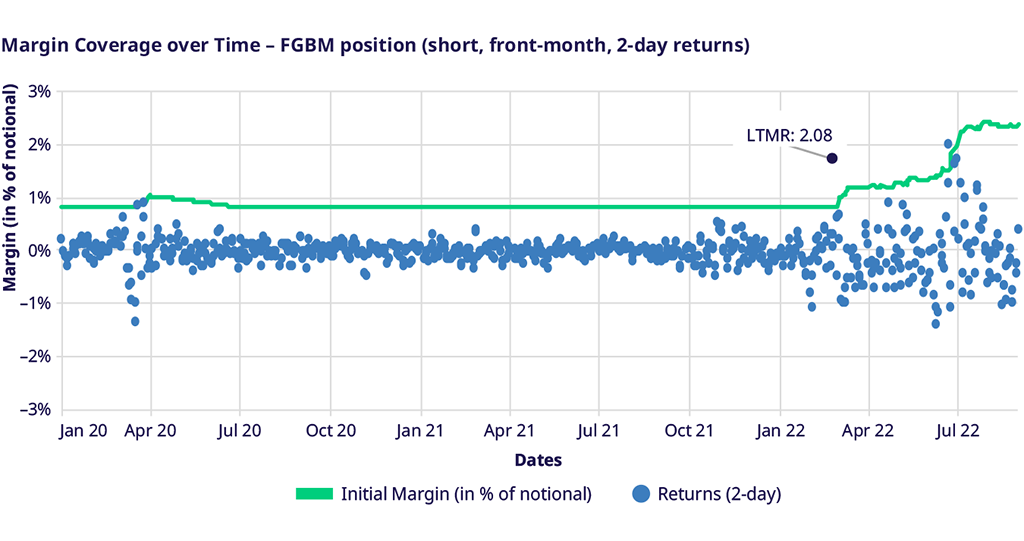
Figure 4: Product level backtesting for short position in FGBM front-month future (Initial Margin2 against 2-day returns), margin exceedance between February 25th, 2022, and March 1st, 2022, marked in dark blue.
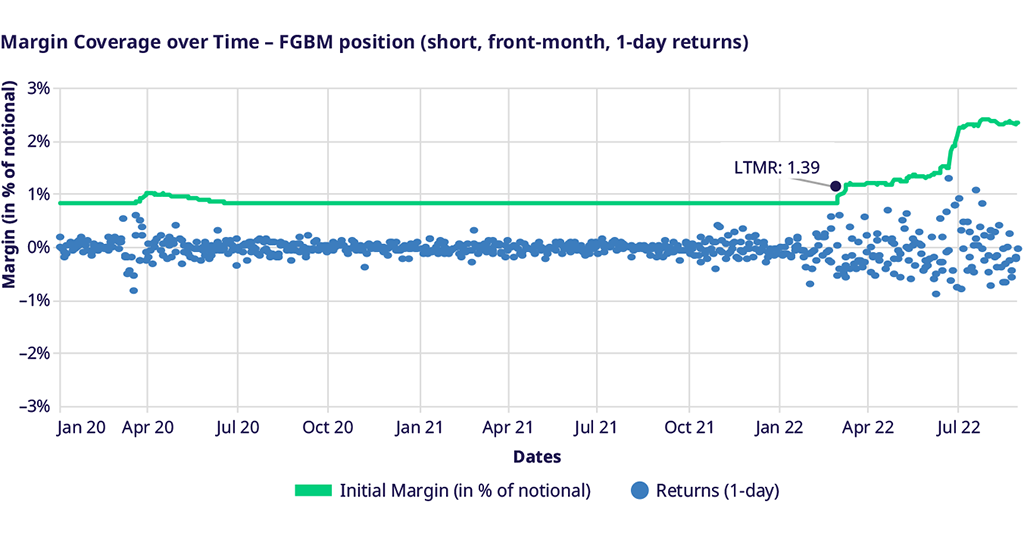
Figure 5: Product level backtesting for short position in FGBM front-month future (Initial Margin against 1-day returns). Margin exceedance between February 28th, 2022, and March 1st, 2022, marked in dark blue.
Summarizing observations described above, margin breaches for Fixed Income ETD portfolios (including the EUR 706 mn margin exceedance as reported within the Q1 and Q2 2022 CPMI IOSCO disclosures) observed in the beginning of the Ukraine crisis are caused by a “Flight-to-Quality” market move. Moreover, outliers are driven by short exposures to Government bond futures and market moves in the underlying instruments beyond the confidence level targeted by the margining model. Furthermore, relative margin exceedances on a portfolio level measured by the loss-to-margin ratio remain within a limited magnitude and are consistent to observations which can be made on a product level.
_________________________________________________________________________________________________________________________________
1 Note that under EMIR regulation a minimum MPOR of 2-day is required for all Exchange Traded Derivatives. However, CCP’s in other jurisdictions might also opt for a 1-day MPOR to both margin and backtest for Exchange Traded Derivatives.
2 Initial Margin including add-ons, note that size of PRISMA add-on for liquidity- and concentration risk is negligible for small position sizes.
